The Digital Equity Public Online Survey was launched in May 2023 to allow Californians across the state to provide input that would help inform the State’s Digital Equity Plan and its allocation of millions of dollars to address broadband access, affordability, and adoption in the coming years.
California’s groundbreaking Digital Equity Public Online Survey was available in 14 languages and included an audio option to hear spoken, recorded questions to enable Californians statewide (including those with vision or reading impairments) to respond. The survey was also compatible with both desktop and mobile devices and included a speed test to allow respondents to measure and report their internet speed in real-time.
The Public Online Survey was created to complement the Digital Equity Telephone Survey to allow for more responses at the local and regional levels. It was vetted and widely disseminated through the state’s digital equity ecosystem. The Public Online Survey closed with 43,432 responses from all 58 California counties, with a final tally of 36,273 responses after data cleaning and validation.
See below for a breakdown of responses by geography, responses by covered populations across California relative to Census data for each covered population, and responses by language used to complete the survey.
Survey Responses by County
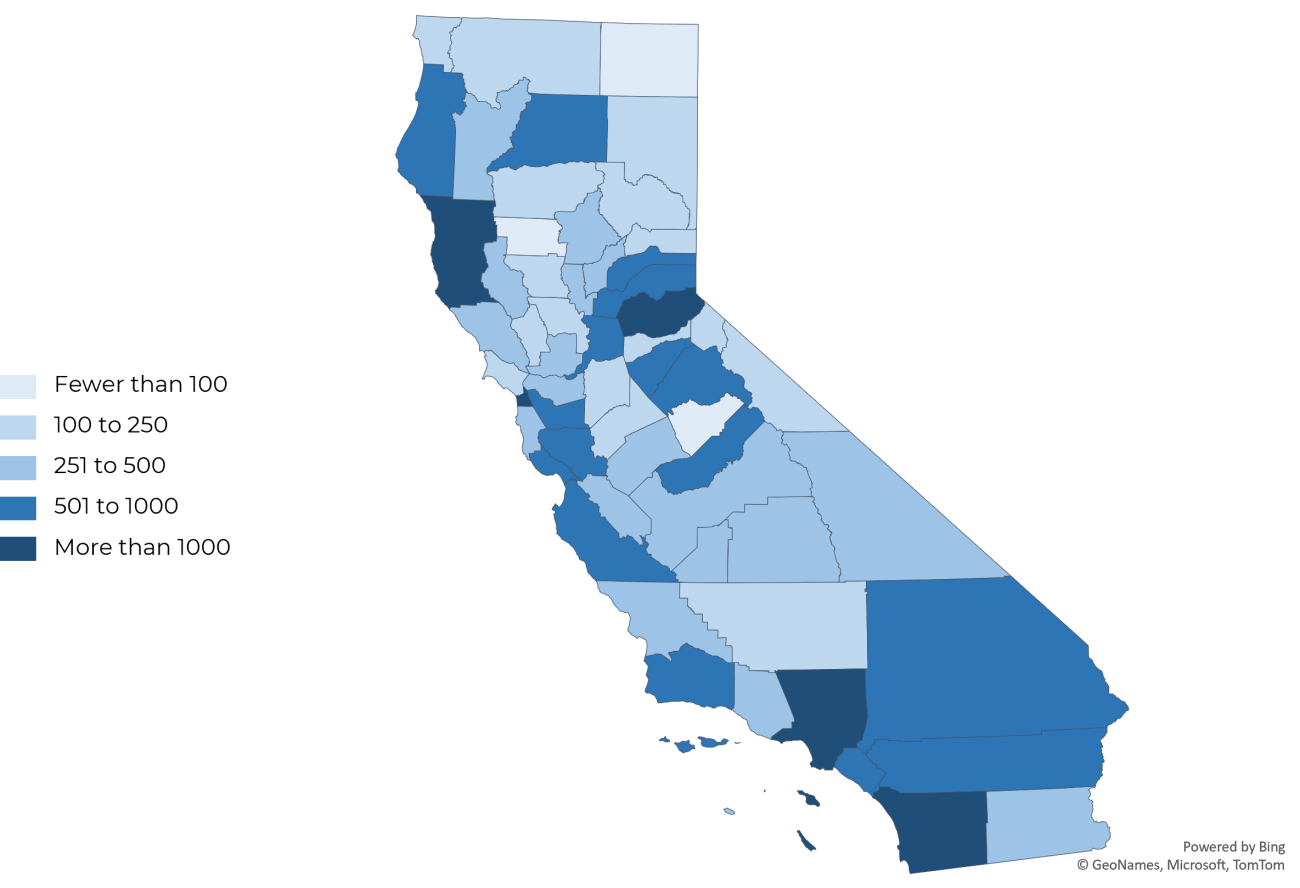
Online Public Survey Responses by County
| Number of Responses | County Name |
| More than 1000 responses | San Diego, Los Angeles, Mendocino, San Francisco, El Dorado |
| More than 500 responses | Tuolumne, Sacramento, Shasta, Santa Clara, Orange, Santa Barbara, Nevada, Riverside, Alameda, Placer, Monterey, Humboldt, Madera, San Bernardino, Calaveras, Santa Cruz |
| 251-500 responses | Butte, Merced, Fresno, Contra Costa, Inyo, Sonoma, Yuba, Sutter, San Benito, San Mateo, Solano, Ventura, Kings, San Luis Obispo, Trinity, Lake, Tulare, Imperial |
| 100 to 250 responses | Siskiyou, San Joaquin, Yolo, Del Norte, Napa, Kern, Plumas, Stanislaus, Sierra, Mono, Alpine, Amador, Lassen, Marin, Colusa, Tehama |
| Less than 100 responses | Mariposa, Glenn, Modoc, Unanswered |
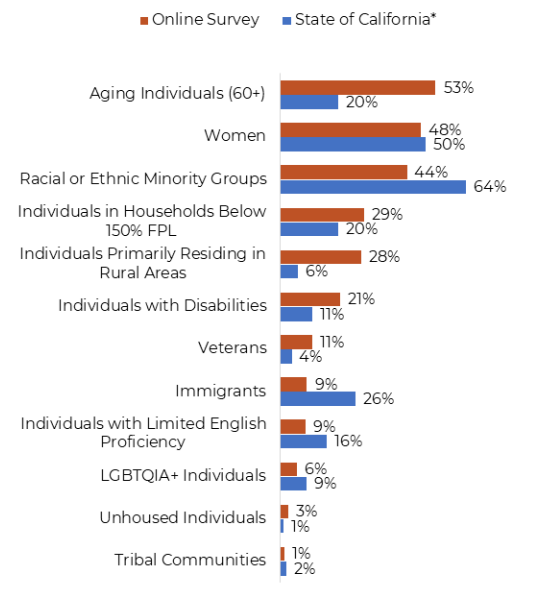
Survey Responses by Covered Population
Survey Responses by Language
| Language | # of Responses | Percent of all Responses |
|---|---|---|
| English | 39,353 | 91% |
| Spanish | 2,445 | 6% |
| Simplified Chinese | 736 | 2% |
| Traditional Chinese | 346 | 1% |
| Arabic | 137 | 0.3% |
| Vietnamese | 111 | 0.3% |
| Persian | 61 | 0.1% |
| Korean | 59 | 0.1% |
| Tagalog | 58 | 0.1% |
| Russian | 58 | 0.1% |
| Japanese | 40 | 0.1% |
| Khmer | 14 | – |
| Punjabi | 13 | – |
| Armenian | 1 | – |
Additional Resources
For additional key findings from the California Digital Equity Public Online Survey, see the complete Digital Equity Online Survey Analysis and Needs Assessment Data Report, Digital Equity Online Public Survey Select Findings, and SDEP Online Public Survey Summary Tables.