On this page
- 3.1 Introduction
- 3.2 Digital Equity Assets
- 3.3 Overview of Digital Equity Needs and Barriers
- 3.4 Specific Barriers and Baseline for Covered Populations and Digitally Disadvantaged Communities
- 3.5 Specific Barriers by Priority Outcome Area
- References
3.1 Introduction
As noted in the State’s Broadband for All Action Plan in 2020, the vast size and diversity of California makes broadband delivery a complex issue.[104] California’s diverse geography and topography pose immense challenges. Five percent of California’s population is spread across 147,000 square miles of the state, while the remaining 95% live in urban areas that span 8,200 square miles.[105] This geographic divide compounds the digital divide in California.[106]
There are regional and local differences in the amount of historic investment, lack of competition, and need for additional funding to incentivize broadband infrastructure expansion and adoption. This has led to disparate access and a persistent digital divide that impacts our most vulnerable communities and residents. This Plan is focused on alleviating digital equity barriers for members of covered populations who are most impacted by the digital divide.
Access
At the close of 2018, nearly 95% of the State’s households had access to broadband download speeds that were advertised at 100 Mbps or greater due to extensive deployment of cable and fiber infrastructure in densely populated urban areas.[107]
Using the NTIA and FCC’s broader eligibility criteria for served locations, California has an estimated 306,910 unserved locations (lacking 25/3 service) and an additional 151,107 underserved locations (lacking 100/20 service) based on FCC data.[108]
Affordability
According to data from CETF and California State University, Chico, 2.7 million (47%) of the 5.8 million eligible households are enrolled in the ACP.[109] Concurrent with the CPUC’s BEAD Five-Year Action Plan, this Plan found that while low-cost internet service offers and subsidies are available, there is low awareness of these programs.[110] Additional barriers include difficult enrollment processes, eligibility rules that don’t factor in California’s high cost of living, lack of culturally competent and accessible outreach, and general mistrust in government and corporations.[111]
Adoption
U.S. Census Bureau data indicates that about 8% of households in California lack a computer or broadband subscription. Further, about 19% of the State’s population does not use the internet, and around a third of the population does not use a tablet or computer.[112]
The statewide telephone survey and online public survey obtained granular data on Californians’ comfort level with device usage, digital literacy skills, and online privacy and cybersecurity. The telephone survey found that one-third of households that do not subscribe to the internet do so because nobody in the household has a desktop, laptop, or tablet, supporting the theory that device access impacts broadband connectivity.[113]
Seventy-one percent of respondents to the online public survey said they use a laptop, with 54% using a tablet and 40% using a desktop to connect to the internet. However, over 90% said they use a smartphone to connect to the internet, making it the most used device.[114] Per the NTIA’s Internet Use Survey, 34.8% of Californians do not use a desktop, laptop, or tablet.[115]
When asked about digital skills, 56% of respondents to the telephone survey self-identified as “high-skill” users.[116] Most respondents to the online public survey said they were comfortable with basic skills such as sending an email with an attachment (84%) or searching for a job online (84%).[117] However, a much lower percentage of respondents to the online public survey (57%) said they were comfortable with cybersecurity such as setting up protections against phishing and spam email. There is strong interest by respondents (33%) to take an internet or computer training course.[118]
Data
Data granularity and accuracy was cited as a barrier during the development of the Broadband for All Action Plan and remains a barrier today.[119] While significant efforts have been made at the state and federal levels to improve broadband availability, affordability, and adoption data, there are small but significant differences in what the data is saying and is heard from communities and residents based on their lived experiences.
For example, the data from NTIA and the FCC may indicate that 95% of the state has served levels, but according to the California Community Foundation, “19% of LA County households and 16% of California households remain unconnected or under-connected to the internet.”[120] Similar input has been shared throughout the planning process from other entities including the Fresno Coalition for Digital Inclusion,[121] and #OaklandUndivided.[122] Both statements may be true because of how the Federal and State programs define “served,” while “unconnected” could be due not only to lack of facilities, but also lack of affordability, or lack of a device.
Continuing to prioritize the accuracy of data at the location, household, and unit level is critical to understanding the true extent of the barriers and creating strategies to counteract those barriers. CDT and CPUC are committed to improving the state’s data collection methods and working with stakeholders at the State and local level.
3.2 Digital Equity Assets
California has a strong and increasingly mature digital equity ecosystem that has been growing since the creation of the CBC. While developing the Broadband for All Action Plan, the State expanded its awareness of State agencies, organizations, entities, programs, and funding sources that support digital equity efforts.
CDT and CPUC are coordinating the development of the State’s asset inventory through the concurrent SDEP and BEAD planning process. Because both efforts are designed to create one State asset inventory, CDT included most of the assets CPUC identified in the BEAD Five-Year Action Plan in this Plan’s asset inventory.
CDT also gained new insights into California’s digital equity landscape through a new Digital Equity Ecosystem Mapping (DEEM) effort. More than 400 community anchor institutions, government and public organizations, private sector and non-governmental organizations, Internet Service Providers, and tribal entities used new DEEM tools to “put themselves on the map,” sharing details about the digital inclusion programs, services, and assets they provide. The DEEM tools identified organizations, programs, resources, and gaps in California’s digital equity ecosystem and further informed the State’s asset inventory included in this Digital Equity Plan.
This section includes:
- An overview of organizations whose work is essential to achieving the State’s Broadband for All goals,
- A summary of DEEM respondents, and
- Key findings and gaps in existing efforts.
CDT acknowledges that this Plan is not inclusive of all the assets in the State. Given the state’s scale, it is difficult to accurately quantify where gaps in digital inclusion programs and services exist relative to needs. Nonetheless, the planning and engagement process that informed this Plan, including hundreds of meetings with organizations supporting digital inclusion activities and responses to DEEM tools, shaped CDT’s understanding of its role in strengthening this ecosystem statewide and for covered populations.
Overview of Organizational Assets
California has long engaged with a wide range of organizations throughout the state to promote digital equity. From the creation of the Broadband for All Action Plan through the development of this SDEP, these entities have consistently partnered with the State to ensure progress is being made toward digital equity. These entities include statutory bodies such as members of the CBC, State agencies for education, workforce and economic development, health and civic participation, nonprofits, community- based organizations, and local, regional, municipal, and tribal governments. A complete list of these entities can be found in Appendix B.
California Broadband Council Members, Action Item Plan Parties, and Key Partners
Members of the CBC, entities responsible for implementing various items in the Broadband for All Action Plan, and key partners all played significant roles in the digital equity planning process. Many of these entities are part of the Middle-Mile Broadband Initiative, Middle-Mile Advisory Committee, the digital equity Statewide Planning Group (SPG) and the Outcome Area Working Groups. These entities were critical to the development of the plan and will be highly engaged in its implementation. A complete list of these entities can be found in Appendix C.
Regional Broadband Consortia
The Regional Broadband Consortia support the deployment of broadband services in regional and local communities, including provide technical support for applicants to State programs in project development and application processes. Regional Broadband Consortia are supported by the CASF Rural and Urban Regional Broadband Consortia Account, administered by the CPUC, which has distributed $10 million to 15 regional consortia for work over the next three to five years.[123]
Regional Broadband Consortia have been critical participants throughout the outreach and implementation processes for Regional Planning Workshops, as well as disseminating both the telephone and online survey, and the DEEM tool to their respective networks. A complete list of the Regional Broadband Consortia and the Counties they represent can be found in Appendix D.
Statewide and Regional Partners
CDT collaborated closely with many statewide and regional partners in support of its digital equity planning efforts. Many of the following partners have collaborated with CDT since 2020 in support of the development of the Broadband for All Action Plan. These partners assisted in the implementation of Action Items and worked with CDT throughout the development of the SDEP. These partners were instrumental in a successful public engagement campaign, ensuring that voices community members and those with lived experience could participate in the process. A complete list of Statewide and Regional Partners can be found in Appendix E.
Local Digital Equity Coalitions
Local Digital Equity Coalitions play an important role in informing and engaging local communities on matters of digital equity. A resource guide was developed to assist local and regional governments in designing their own digital equity plans.[124] A list of Local Digital Equity Coalitions who partnered in this effort can be found in Appendix F. These organizations were included in outreach for all forums noted in Section 4 of this document and were also encouraged to invite their networks to participate as well.
State-Managed Assets for Access, Affordability, and Adoption[125]
The State of California currently manages a significant inventory of physical assets, grants, and public-facing informational resources in support of digital equity. The following assets are managed or administered by multiple State agencies but are all in support of digital equity. A list of State-Managed Assets for Access, Affordability, and Adoption can be found in Appendix G. This is a non-exhaustive list. CDT and CPUC are coordinating to have one asset inventory. Additional assets can be found in the California BEAD Five Year Action Plan from pages 45 – 63.
Digital Navigation Service Providers
Per Assembly Bill 2750 (Chapter 597, Statutes of 2022) CDT is required to include in the Digital Equity Plan, “An assessment of existing digital navigation programs in the state and recommendations for a statewide strategy for digital navigators to serve covered populations, including opportunities to integrate with other social service outreach programs and opportunities for covered populations to participate as navigators with training they can then leverage to enter careers in the information technology sector.”[126] A complete list of organizations who responded to the DEEM tool and self-identified as offering digital navigation services can be found in Appendix H.
Digital Equity Ecosystem Mapping (DEEM) Tool
CDT developed the DEEM tool to further build out the State’s existing asset inventory at a more granular regional and local level and to better understand the organizations and entities providing digital equity services in California. The DEEM tool has enabled CDT to expand its statewide inventory of entities, programs, and funding sources methodically. Most importantly, the DEEM tool identified where resource gaps exist. CDT intends to update the DEEM tool on an annual basis.
The DEEM tool was promoted through email campaigns with multiple distribution partners, via social media, direct outreach to organizations, and at State Digital Equity Planning engagement opportunities including quarterly Statewide Planning Group Meetings, Outcome Area Working Group Meetings and Regional Planning Workshops. Other partners in CDT’s ecosystem further promoted the DEEM tool among their constituents, including AARP, RCRC, CWA, SANDAG and CSL.
CDT created three versions of the DEEM tool to address the unique needs of government and community-based organizations, internet service providers, and tribal entities. The tool was distributed over six months, from February to August 2023, and garnered 466 responses. As of August 2023, the DEEM tool has reached over 1,400 organizations across the state. These organizations include educational institutions, community-based organizations, private companies, and government entities. See Appendix I for a complete list. A list of programs offered by DEEM respondents will be forthcoming on the Broadband for All portal.
Respondent Profiles
Respondents to the DEEM tool represent a broad array of organization types within California. The three organization types surveyed include community-anchor institutions, government and public organizations, and private sector and non-governmental organizations.
A complete list of organizations that responded to the DEEM tool, their program(s), covered populations they serve, and funding sources can be found on the Broadband for All portal.
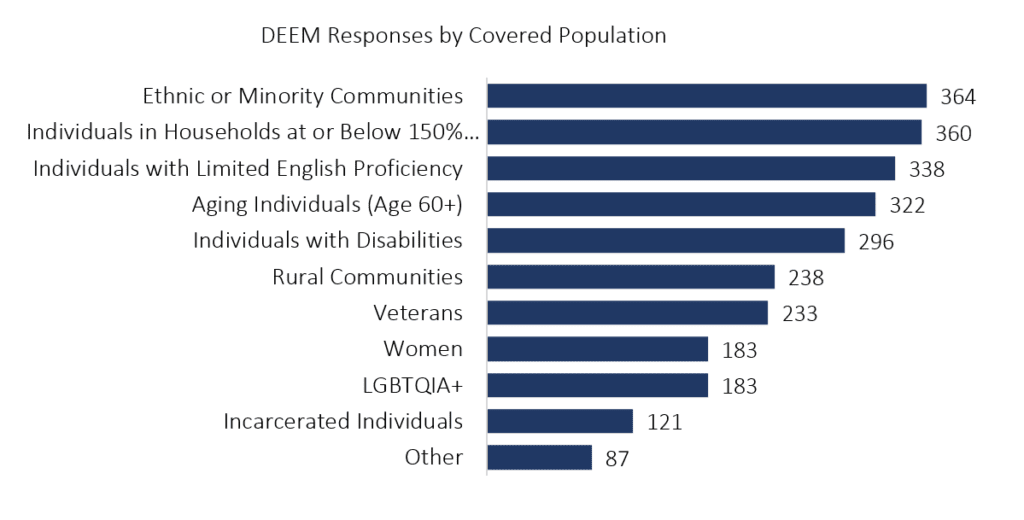
Additional Assets by Covered Population
The DEEM tool indicates that there are 320 or more organizations that serve half of the covered populations, and that ethnic or minority communities are the most served covered population among the data collected. There is a stark difference between the most and least-served covered populations – for example, incarcerated individuals have access to only a third of the organizational resources that are available to ethnic and minority communities.
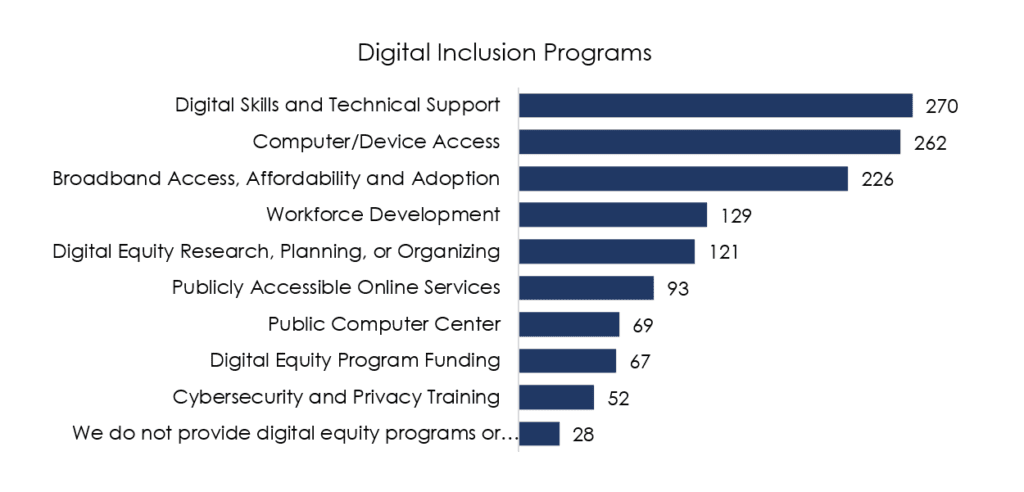
Additional Assets by Program Type
The DEEM tool collected information regarding the type of digital inclusion programs available in the State. The following chart provides a snapshot of the number of locally based programs for which CDT has collected detailed programmatic information through DEEM.
Additional Assets by County
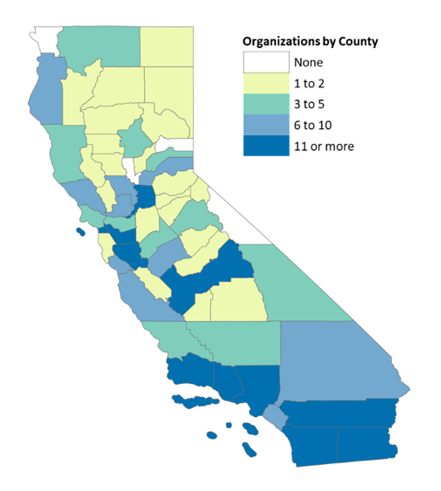
The following chart provides a snapshot of where local digital inclusion organizations are based in the state. Given that these data is incomplete, this map represents a summary of where organizations who participated in DEEM to date are located.
It also represents the location of those organizations and may not be reflective of the service areas for each organization.
| Number of Responses | California County |
|---|---|
| None | Del Norte, Mono, Sierra, Sutter |
| 1-2 | Alpine, El Dorado, Glenn, Madera, Napa, Plumas, San Benito, San Mateo, Tulare, Amador, Calaveras, Colusa, Kings, Lake, Lassen, Mariposa, Modoc, San Joaquin, Shasta, Tehama, Trinity, Yuba |
| 3-5 | Butte, Marin, Mendocino, Nevada, San Luis Obispo, Contra Costa, Stanislaus, Inyo, Kern, Siskiyou, Tuolumne |
| 6-10 | Merced, Monterey, San Bernardino, Solano, Humboldt, Yolo, Orange, Placer, Santa Cruz, Sonoma |
| 11 or More | Los Angeles, San Francisco, Sacramento, Alameda, San Diego, Fresno, Santa Clara, Ventura, Riverside, Santa Barbara, Imperial |
Internet Service Provider Low-Cost Offers and ACP Participation
The DEEM tool also looked specifically at ISP, and asked whether they participate in ACP or offer a low-cost offer. Of the 33 entities to either participate in the DEEM tool or be listed in the BEAD Five-Year Action Plan, 18 participate in the ACP, and 17 have a low-cost offer. The complete list can be found in Appendix J.
Key Findings and Gaps in Existing Efforts
For many years, California has been the leader in digital equity. The State leads in building broadband infrastructure, connecting households to internet service, and ensuring its residents can fully utilize the technology. There are hundreds of organizations actively working to promote digital equity, which is unique to this state.
However, with all the successes the State has experienced, there are still ways to improve. Upon review of the DEEM tool responses and organizational engagement, four main barriers and gaps in existing efforts became evident. These gaps negatively impact the ability of organizations to deliver digital equity programs and services.
Top Barriers for Organizations
- Funding and Sustainability: The most cited barrier to providing digital equity services was the lack of access to sustainable funding to support their organization. Approximately two-thirds of device access and digital skills organizations reported this as their number one barrier.[127] Sustainable and reliable funding is critical to organizations providing support to covered populations across the state. This Plan intends to provide financial support to entities that provide digital equity and digital inclusion services to residents of California.
- Staff and Organizational Capacity: Adequately trained staff and support are crucial to organizations providing digital equity services. Staff are the ones out in the communities teaching digital literacy skills, conducting ACP outreach, and engaging with community members, especially members of covered populations. Solutions aimed at filling the gap in staffing and organizational capacity are addressed in this Plan.
- Difficulty Accessing and Applying for Funding: When opportunities for funding do arrive, the complexity of applying for and reporting on the funds can overwhelm organizations, especially those with limited resources. Providing technical assistance for organizations seeking grants and/or sources of government funding is addressed in this Plan.
- Lack of Awareness and Engagement: The role of community engagement in promoting digital equity supports and services cannot be stressed enough. Currently, there is a lack of awareness and engagement in communities on the issue of digital equity. Key activities in this Plan aim to support organizations doing this work.
Filling these gaps will be critical to the success of this Plan. By ensuring that organizations that serve covered populations and residents throughout the state have access to sustainable funding, the staff and organizational capacity to serve their communities, technical assistance in applying for and accessing funds, and support in promoting their services, we can ensure progress toward digital equity is being made.
3.3 Overview of Digital Equity Needs and Barriers
CDT developed a multi-pronged, inclusive approach to gather substantial qualitative and quantitative data to serve as this needs assessment’s baseline. The statewide telephone survey, the online public survey, and other data sources, such as the 2021 American Community Survey (ACS) data tables and NTIA Digital Equity Population Viewer, provide quantitative data. The Outcome Area Working Groups, Regional Planning Workshops, Tribal Consultations, one-on-one meetings, interviews, and listening sessions form the basis for the qualitative data provided in this document.
These data sources provide the baselines for the specific objectives provided in Section 2.5. The overarching objectives are:
Through this comprehensive process, the State identified common barriers to digital equity for all Californians impacted by the digital divide and specific barriers experienced by covered populations and digitally disadvantaged communities. This data builds upon the Broadband for All Action Plan, which identified access, affordability, and adoption as the top common barriers to digital equity. These overarching barriers remain today and further elucidate the findings in this Plan.
Access
Barriers to equitable access to broadband include:
- Lack of available infrastructure and service,
- Lack of reliable/resilient service,
- Evolving state broadband data and maps, and
- Uncertain localized labor supply for broadband infrastructure jobs.
A central barrier to internet access is the lack of available broadband infrastructure and service. For many California residents, businesses, and community anchor institutions, a high-speed internet connection is simply not available at their address. This barrier affects communities across the state. Many steps are being taken through the MMBI and CPUC’s last-mile programs, and efforts to increase access will be further supported by BEAD investments.
About a third of telephone survey respondents and online survey respondents who cannot access internet from home cited that a lack of available or adequate internet services at their home presented as an important barrier that contributed to their lack of home internet access.[128] According to the telephone survey, covered households, individuals with language barriers, individuals who are members of a racial or ethnic minority group, and individuals that primarily reside in a rural area reported lower rates of connectivity at home compared to the state as a whole.[129]
Even when an address is technically serviceable by an ISP, many Californians face a secondary barrier in the lack of reliable and resilient service, as reflected by inconsistent broadband speeds and regular outages. Covered households, individuals with disabilities, individuals with language barriers, individuals who are members of a racial or ethnic minority group, individuals who primarily reside in a rural area, and individuals who identify as LGBTQIA+ all report unreliable service at a higher rate than overall respondents.[130]
Rural communities, tribal lands, and certain urban areas face resiliency challenges that impact residents’ ability to receive online government services, conduct remote work, engage in distance learning, or benefit from online healthcare services. Lack of reliable service in rural communities hinders the effective implementation of emergency services, including delivering emergency evacuation orders to residents and locating residents who need emergency assistance.[131]
Californians’ need for high-performance broadband continues to increase, yet the economics of infrastructure deployment often discourage investment in rural and tribal communities.[132] Deployment in these communities often means thinner profit margins and more capital-intensive investments, which discourage competition among providers.[133] Public interventions in the form of capital subsidies like those offered through CASF are necessary to incentivize providers to deliver service to these communities.[134] The State’s Broadband for All investments, including middle- and last-mile programs funded in SB 156, Federal Funding Account, Loan Loss Reserve Fund, and the BEAD program will further address incentives network build-out.
A third barrier associated with internet access stems from California’s evolving state broadband data and maps. While federal and State broadband data and mapping efforts have significantly improved, current data and mapping definitions do not reflect the lived experiences of communities across the state.
The CPUC has compiled extensive data within its Annual Affordability Report,[135] which aggregates pricing and service offering data from communication service providers to monitor pricing trends in different areas of the state. Continued collection of granular broadband deployment and subscriber data will allow for better understanding and assessment of unserved and underserved locations in California to effectively target resources as needed. The data will also inform public policies looking to bridge the digital divide in California.
Finally, the uncertain localized labor supply for broadband infrastructure jobsis projected to be a significant barrier to the speedy deployment of new and improved broadband networks across the state. Communities and ISPs that are poised to address the access barrier may increasingly encounter labor force challenges when they begin to build those broadband networks.
Many experts have reported that the lack of labor access is prohibitive to broadband deployment, and that long-term wage stagnation in the telecommunications industry has impeded hiring and retaining skilled workers.[136] CDT plans to collaborate closely with the CPUC to promote workforce development efforts and encourage the equitable hiring and training of employees as part of SDEP and BEAD-funded projects.
The results of this needs assessment confirm that expanding access to reliable, high-speed broadband, both at home and throughout the community, and ensuring that broadband services are adequate for the needs of households is a priority in advancing digital equity.
Affordability
In addition to access, affordability remains a top barrier for households and individuals accessing at-home broadband services. Through the engagement process, CDT identified affordability barriers that include:
- Lack of awareness of low-cost offers, such as the ACP,
- Challenging enrollment process with the ACP, and eligibility does not reflect high-cost communities within California,
- Need for a sustainable, low-cost subsidy,
- Lack of consumer choice and competition, and
- Mistrust of government and corporations.
There is a lack of awareness of low-cost offers, such as the ACP. California has invested in ongoing efforts to spread awareness of affordability programs, such as Get Connected! California Mobilization to increase enrollment in the ACP. However, as of November 2023, about 2.7 million households in California have enrolled in ACP, which represents about 47% of eligible households.[137] Nearly 77% of respondents to the telephone survey from unconnected households[138] were unaware of the program. Of those who were aware of the program but were not signed up, about 29% of telephone survey respondents stated that they thought they would not qualify, and about 23% reported not knowing how to apply.[139]
Even when households are aware of low-cost offers, the complexity of the ACP enrollment process can be challenging, and eligibility does not reflect high-cost communities within California. It is clear that “awareness is not enough to effectively increase enrollment among eligible households, and that local outreach efforts … include assistance in navigating the enrollment process.”[140] Outreach efforts must be targeted and appropriate to the different characteristics of the population across regions.
There is still a need for a sustainable, low-cost subsidy above that which is provided by ACP.As it stands, ACP has finite resources that are quickly being depleted, and Californians would greatly benefit from a renewed federal broadband subsidy. Campaigns to raise awareness of low-cost offers and subsidies and efforts to provide enrollment assistance in these programs could be funded by the State’s allocation of the Digital Equity Capacity Grant, Digital Equity Competitive Grants, and other efforts funded by private sector and philanthropic organizations.
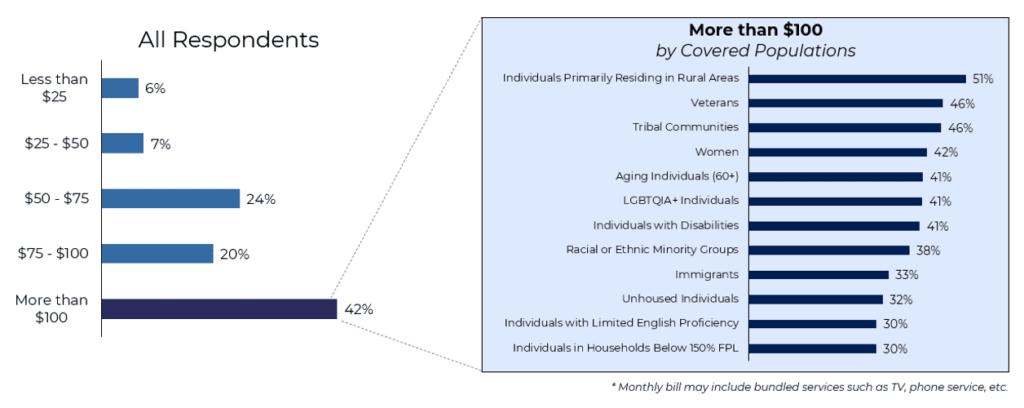
Additionally, a lack of competition amongst providers limit consumer choice and negatively impact costs for Californians. Covered population households that responded to the telephone survey cited an average monthly cost of $83.60,[141] which is comparable to the 2023 FCC Broadband Rate Survey for California of $82.40/month.[142] Online public survey respondents who can access internet from home reported paying an average of $102.72 for their home internet service.[143] Moreover, CPUC’s 2018 Competition Report found that 35% of California households have access to only one provider offering service greater than 25/3 Mbps, and only 6.8% have access to three providers offering service greater than 25/3 Mbps.[144]
The CPUC’s Rulemaking to Establish a Framework and Processes for Assessing the Affordability of Utility Service (R.18-07-006) emphasizes the importance of affordable utility services, including communications services, for individuals’ health, safety, and participation in society.[145]
Finally, we learned from the OAWGs, regional workshops, interviews, and listening sessions that another reason for households not enrolling in ACP is a mistrust of government and corporations, including a resistance among some residents to apply for programs, and a lack of information being developed in-language by trusted messengers. One respondent to our DEEM tool stated, “Many of our residents don’t qualify or won’t accept or apply for statewide services such as CalFresh, Women Infants and Children (WIC), and more. This makes qualifying or enrolling in ACP more difficult.”
Existing Broadband for All investments are working to address affordability via expanding competition, including the CASF programs, MMBI, FFA, and the Loan-Loss Reserve.
Adoption
Californians face additional barriers related to digital literacy and skills, device access, cybersecurity and online privacy. These adoption barriers include:
- Lack of awareness of low-cost offers and subsidies,
- Lack of access to affordable devices,
- Lack of perceived need through a reliance/dependence on mobile phones,
- Lack of digital literacy skills and training (basic, intermediate, and advanced), and
- Lack of technical familiarity or awareness due to the rapid pace of change in hardware and software technology.
As mentioned above, lack of awareness of low-cost offers, such as the ACP, is a barrier for households. Additionally, the cost of devices is a very real barrier to sustainable broadband adoption. Thirty-three percent of respondents to the telephone survey stated, “Nobody in my household has a desktop, laptop, or tablet computer” as a reason for not having internet access at home.[146] Ensuring households have access to high-quality, low-cost devices is important to achieving digital equity.
Among online public survey respondents, a smartphone is the most abundantly available and widely used device, with 43% of unhoused individuals relying exclusively on smartphones to access the internet.[147] For individuals with limited English proficiency and individuals in households below 150% of FPL, 23% of respondents use smartphones only.[148] Without affordable laptop or desktop computers, these individuals are highly constrained in the resources and digital opportunities they can access online.
For some, the reason they rely on smartphones and may not have a home broadband subscription altogether is a lack of perceived need for a home broadband connection. As the Broadband for All Action Plan discusses, broadband adoption requires more than availability and affordability of service and devices. Individuals must be exposed early and often to the breadth of digital opportunities available online, including digital skills training for job opportunities.[149]
A third barrier to adoption is the lack of digital skills, which the telephone survey found to be the most relevant barriers for digital equity.[150] The share of advanced-skills[151] users is significantly below-average for non-English language households (40%), among low-income residents (42%), and households with disabilities (43%).[152] About a third of online public survey respondents said that they would be interested in participating in computer training classes, indicating significant demand in the state for increased opportunities for building computer skills.[153] Individuals with limited English proficiency and immigrants demonstrated the greatest interest in such opportunities.[154]
About a quarter of all online public survey respondents said they were unfamiliar with cybersecurity measures. Individuals with limited English proficiency, immigrants, individuals living in covered households, and those who identified as belonging to racial or ethnic minority groups all had lower rates of familiarity with these measures than the overall survey respondents. Veterans and rural residents had the highest rates of familiarity.[155] Cybersecurity and online privacy should be considered critical components of any digital skills training.
As technology rapidly evolves, the lack of technical familiarity or awareness of hardware and software will be an increasingly challenging barrier to address. Continued investment in digital skills training will be necessary to ensure that Californians are not left further behind, particularly for covered populations with additional vulnerabilities.
These barriers to access, affordability, and adoption are found across almost all covered populations and throughout the state. The implementation strategies and key activities (see Section 5) aim to address them in the State’s effort to advance digital equity.
3.4 Specific Barriers and Baseline for Covered Populations and Digitally Disadvantaged Communities
Solutions for digital equity are not one-size-fits-all, and different covered populations start from different baselines, with some in greater need than others across different dimensions of access, affordability, and adoption. This section highlights some of those differences between each covered population and digitally disadvantaged community. It includes both specific barriers that were elevated through CDT’s multi-pronged research and engagement program, as well as specific data points regarding the different baseline conditions for these populations when the baseline data demonstrates that that population needs greater attention to realize the State’s targets for a given objective.
Individuals who Live in Covered Households (under 150% FPL)
| Covered Population | Specific Barriers |
| Individuals who Live in Covered Households (under 150% FPL) |
|
Among lower-income online public survey respondents who were completely unconnected, 77% of respondents cited the Internet being too expensive as a reason by they do not subscribe to home internet, and 21% cited the lack of internet availability as the reason why they do not subscribe to home internet access.[156]
Further, there are barriers specific to multi-dwelling units (MDUs), including public housing; access to MDUs and public housing buildings poses a barrier to internet connectivity. In addition, MDUs pose a data challenge, as individual units within these buildings are often inaccurately accounted for in state and federal broadband mapping efforts.
These inaccuracies can result in a lack of eligibility for funding opportunities and can make it more difficult to target solutions. Another challenge related to housing is industry practices that constrain service availability or options where multiple families reside in the same unit.
Goal 1
All Californians have high-performance broadband available at home, schools, libraries, and businesses.
- Objective 1.1 – Increase the percentage of Californians who are connected to broadband internet service.
- Baseline – According to a representative sample of Californians surveyed for this Plan, 87% of covered households indicate they are connected, as compared to 91% of all Californians.[157]
- Objective 1.3 – Increase the percentage of Californians who report that their internet service is reliable.
- Baseline – While 62% of telephone survey respondents rate the reliability of their service at “4” or “5” (highest possible), only 58% of low-income households do so, likely because these households have fewer service options and are often priced out of higher-speed service tiers.[158]
Goal 2
All Californians have access to affordable broadband and necessary devices.
- Objective 2.1 – Decrease the percentage of Californians who cite cost as the primary barrier to internet service.
- Baseline – Seventy-seven percent of covered household respondents to the online public survey cited cost as the main reason for not having an internet connection at home, 7% higher than overall respondents.
- Objective 2.2 – Reduce the percentage of Californians who rely solely on a smartphone to use the internet.
- Baseline – Twenty-three percent of respondents from covered households use a smartphone only to access the internet, compared to 10% of overall respondents.[159]
Goal 3
All Californians can access training and support to enable digital inclusion.
- Objective 3.1 – Increase the availability of digital literacy, cybersecurity, and skills training programs.
- Baseline – CDT is tracking 270 programs that currently offer digital training skills support in the state, with meaningful differences by geography. 47% of covered household online survey respondents indicated an interest in internet or computer training class, 14% greater than overall respondents.[160]
- Objective 3.2 – Increase the percentage of Californians who have access to technical support services for internet-connected devices.
- Baseline – Twenty-eight percent of covered household respondents indicated they do not have access to technical support services in their household or community, 6% higher than overall respondents. [161]
- Objective 3.3 – Reduce the percentage of Californians whose concerns for privacy and cybersecurity prevents broadband adoption or effective use
- Baseline – Forty percent of online survey respondents from covered households are unfamiliar with cybersecurity, 18% higher than overall respondents; 31% have no cybersecurity measures setup on their devices or do not know if they do, 14% greater than overall respondents.[162]
- Objective 3.4 – Increase the percentage of Californians who possess basic, intermediate, and advanced digital literacy skills.
- Baseline – Forty-seven percent of individuals from covered households are interested in internet or computer training classes, 14% higher than overall respondents.[163] Twenty-nine percent of online survey respondents from covered households are less than comfortable with downloading and installing a new app on their smartphone or tablet, compared to 19% overall; 29% are less than comfortable making an appointment online (ex. DMV), compared to 17% overall; and 25% are less than comfortable when paying bills online, compared to 15% overall.[164] While 56% of telephone survey respondents were found to have advanced digital skills, just 42% of those in covered households reported the same.[165]
- Objective 3.6 – Increase the percentage of Californians who utilize the internet to apply for or use public benefits and other essential services and can participate in civic and social engagement online.
- Baseline – While 46% of all telephone survey respondents use telehealth, 42% of those in covered households report the same.[166]
Aging Individuals (60+ Years)
| Covered Population | Specific Barriers |
| Aging Individuals (60+) |
|
CDT worked closely in conjunction with other statewide and regional entities including California Department of Aging (CDA), AARP of California, San Francisco Tech Council, Bay Area Digital Equity Coalition, Community Tech Network and the Older Adults Technology Services (OATS) to best understand the unique barriers facing aging individuals.
Aging individuals face several barriers to digital equity, including a lack of perceived need and a lack of adequate devices and technology. They also need services, devices, outreach, training, and support to be offered in-language.[167] In addition, aging individuals often lack the digital skills and training opportunities needed to use technology.
Older adults expressed fear of being scammed or taken advantage of when getting online.[168] When compared to the overall online public survey population, a greater share of aging individuals—more than one in four respondents who identified as aging— felt less than comfortable when connecting a computer or smartphone to a Wi-Fi network.[169] The trend on the online public survey was consistent among aging individuals for other basic skills, as well, such as sending an email with an attached image or document or searching for information about jobs and healthcare.[170] This lack of comfort with technology can be a significant barrier to using digital resources.
Goal 2
All Californians have access to affordable broadband and necessary devices.
- Objective 2.3 – Increase the percentage of Californians enrolled in low-cost internet options and subsidies.
- Baseline – According to the telephone survey, 7% of aging individuals that have heard of the ACP are enrolled in the program, 5% lower than overall survey respondents (12%).[171]
- Objective 2.4 – Reduce the average cost that covered populations pay for internet service.
- Baseline – Telephone survey results show that Californians spend an average $83.60/month on broadband, but aging individuals spend on average $85.90/month.[172]
Goal 3
All Californians can access training and support to enable digital inclusion.
- Objective 3.1 – Increase the availability of digital literacy, cybersecurity, and skills training programs.
- Baseline – Thirty-four percent of aging individuals indicated an interest in internet or computer training courses, 1% higher than overall respondents.[173] CDT is tracking 270 programs that currently offer digital training skills support in the state, with meaningful differences by geography.
- Objective 3.2 – Increase the percentage of Californians who have access to technical support services for internet-connected devices.
- Baseline – Twenty-four percent of online survey respondents who identify as aging individuals say they do not have access to technical support services in their household or community, 2% greater than overall respondents.[174]
- Objective 3.3 – Reduce the percentage of Californians whose concerns for privacy and cybersecurity prevents broadband adoption or effective use.
- Baseline – Twenty percent of online respondents who identified as aging individuals are unfamiliar with cybersecurity, 2% greater than overall respondents.[175]
- Objective 3.4 – Increase the percentage of Californians who possess basic, intermediate, and advanced digital literacy skills.
- Baseline – Thirty-four percent of online respondents who identify as aging individuals are interested in internet or computer training classes, 1% higher than overall respondents.[176] Twenty-three percent of online survey respondents who identify as aging individuals are less than comfortable with downloading and installing a new app on their smartphone or tablet, compared to 19% overall; 19% are less than comfortable making an appointment online (ex. DMV), compared to 17% overall; and 17% are less than comfortable when paying bills online, compared to 15% overall.[177] While 56% of overall telephone survey respondents were found to have advanced digital skills, just 42% of aging individuals reported the same.[178]
Incarcerated Individuals
| Covered Population | Specific Barriers |
| Incarcerated Individuals Baseline: 0.5% |
|
CDT has been working closely with the California Department of Corrections and Rehabilitation (CDCR) and its affiliate, California Prison Industry Authority (CALPIA); the Los Angeles County Jail System (LASD), which is one of the largest jail systems in the world; Santa Clara County’s Office of Diversion & Reentry Services; NextGen Policy; Tech Exchange; Ameelio; and Second Chance to address ongoing digital equity efforts for incarcerated individuals and justice impacted adults, juveniles and parolees. CDT also collected testimonials from formerly incarcerated individuals at regional planning workshops and outcome area working group sessions. CDT was unable to collect quantitative data from the telephone survey and online public survey, given human subjects research (HSR) protocol restrictions per the NTIA grant.
The unique barriers faced by incarcerated individuals include lack of digital skills training during incarceration, housing, and economic insecurity upon their re-entry to society, and the rapid evolution of technology that occurs while incarcerated. According to the NTIA’s Digital Equity Act Population Viewer, incarcerated individuals make up 0.5% of California’s total population. There are 199,000 incarcerated individuals living in prisons, county jails, and detention centers in California who experience these specific barriers.[179]
Through its engagements with these entities, CDT learned that during incarceration, individuals have limited access to digital tools such as video calls and have lower call quality, resulting in dropping, breaking up, and merging with other calls.[180] In addition, Individuals who have been incarcerated for an extensive amount of time have a particularly difficult time with their reentry process if they have not been exposed to the technological advances that have occurred during their time in the prison system. To address this, CDCR has partnered with CDT to contract with a vendor to enable access to technology and communications via email, and video and audio calls using tablets and kiosks for incarcerated individuals in state prisons.[181] Activities on devices are monitored for safety and security. Access to educational and rehabilitative content, as well as enhanced connectivity to families and communities via these devices, are just some of the direct benefits of the ongoing rollout of tablets throughout the State prison system. For the L.A. County Jail System, however, connectivity for the 15,000 inmates is more challenging, as buildings are old and made of concrete, and Wi-Fi access is not available, even for office staff. Internet connections are hardwired and limited, as there is no ability to install data ports in every cell. The L.A. County Jail System recently sought proposals to partner with a vendor to provide each inmate with access to Wi-Fi and tablets for reading materials, email access, and video calls.
CDCR is working to obtain a Learning Management System (LMS) for its inmates and is currently repurposing gyms and dining halls with access points to serve as classrooms since Wi-Fi access is limited throughout its prison institutions. So far, about 3,000 access points have been installed in various institutions. However, greater Wi-Fi access is required to make it more widely accessible for inmates in all 33 adult institutions. CDCR hopes to eventually make it possible for inmates to continue their education in their cells without always having to be physically present in a classroom. Furthermore, CDCR has 45 fire camps that have no internet access, and access to technology and connectivity is crucial to learning how to manage fires effectively. The lack of technology at the fire camps has made it very challenging to get teachers to these sites. Hence, CDCR sees an urgent need to implement virtual classrooms at these camps.
CALPIA, which functions under CDCR, offers a Career Technical Education (CTE) program that is one of the most effective correctional rehabilitation programs in California, with a recidivism rate of only 9.5% of CALPIA CTE participants. The CALPIA CTE program provides incarcerated individuals with valuable work and training exposure and opportunities to receive accredited certifications. The CTE program includes Computer-Aided Design (CAD) and Computer Coding, among other programs. TechExchange, which offers multilingual and multicultural digital literacy training programs, is interested in partnering with NextGen Policy to scale their digital literacy, device distribution, and internship programs across the state, to include justice-impacted individuals, to enable access to technology-based internship programs in digital literacy, cybersecurity, and coding, as pathways to employment.
The Santa Clara County Office of Diversion and Reentry Services recently conducted a survey with assistance from Summer Fellows from Stanford University. A total of 102 surveys were administered to male and female inmates from the Elmwood Jail, partly to assess internet and device access and usage. A majority (56%) of those surveyed were between 25 and 40 years of age, and over 60% self-identified as belonging to a racial or ethnic minority. Twenty-seven percent indicated they had no income prior to incarceration, and 75% had been incarcerated for one year or less. Nearly 54% indicated they do not own any devices, 26% said they did not know how to access digital devices, and 43% reported that not knowing how to afford technology would be the biggest challenge.
CDT also learned about the importance of providing inmates with access to digital health apps to stay connected to medical and/or substance abuse treatment programs. However, there are very few digital literacy programs available for health applications.
CDT was advised that parole staff see the benefit of using technology to better manage parolees and sex offenders via pre-release video conferences and implementing overall plans for supervision that include family participation in working with parolees via technology.
Veterans
| Covered Population | Specific Barriers |
| Veterans |
|
The California Department of Technology worked closely with CalVet, American GI Forum, and several other Veterans’ organizations to identify specific barriers for Veterans.
Veterans experience unique barriers, including mistrust of government and corporations, economic and housing insecurity, and lack of digital skills and training. Additionally, Veterans are unaware of State or federal subsidy programs, such as the ACP, and how to access them.[182] Barriers expand to accessing virtual healthcare services since medical records and many health services begin by accessing the internet, and Veterans do not have the digital skills and training required.[183]
Goal 2
All Californians have access to affordable broadband and necessary devices.
- Objective 2.3 – Increase the percentage of Californians enrolled in low-cost internet options and subsidies.
- Baseline – According to the online public survey, 8% of Veterans are enrolled in the ACP, while 4% are enrolled in the Lifeline program. These enrollment rates are lower than overall online public survey respondents, which reported a 10% enrollment rate in the ACP and 5% enrollment in Lifeline.[184]
- Objective 2.4 – Reduce the average cost that covered populations pay for internet service.
- Baseline – While telephone survey results show that Californians spend an average $83.60/month on broadband, Veterans pay an average of $105.60/month.[185]
Goal 3
All Californians can access training and support to enable digital inclusion.
- Objective 3.1 – Increase the availability of digital literacy, cybersecurity, and skills training programs.
- Baseline – Twenty-nine percent of Veterans that responded to the online public survey say they would be interested in internet or computer training classes for them or their family; this is 4% lower than overall online public survey respondents (33%).[186]
- Objective 3.4 – Increase the percentage of Californians who possess basic, intermediate, and advanced digital skills.
- Baseline – While 56% of telephone survey respondents were found to have advanced digital skills, 53% of Veterans reported the same.[187]
- Objective 3.6 – Increase the percentage of Californians who utilize the internet to apply for or use public benefits and other essential services and can participate in civic and social engagement online.
- Baseline – Fifty-eight percent of Veterans that responded to the online public survey rarely or never use the internet to apply for or use public benefits ((e.g., CalFresh/SNAP, Medi-Cal, Social Security, etc.), 3% higher than online survey respondents as a whole (55%).[188]
Individuals with Disabilities
| Covered Population | Specific Barriers |
| Individuals with Disabilities |
|
CDT worked with the California Department of Rehabilitation (DOR), the California Department of Developmental Services (DDS), the San Francisco Tech Council, the Community Living Campaign, the Bay Area Digital Equity Coalition, and other organizations serving individuals with disabilities to develop survey guidance and an understanding of specific barriers to digital equity.
The recent significant increase in broadband access by individuals with disabilities “is a remarkable shift in historical trends that brings this disadvantaged group within close distance from the rest of the population.”[189] Ninety-one percent of telephone respondents who self-reported having a member in the household with a disability also cited having internet service.[190]
Individuals with disabilities experience unique barriers when it comes to digital training. A lack of access to accessible hardware and software, as well as the inaccessibility of online services, often limits those with disabilities from engaging with technology. For example, barriers noted include the lack of an inclusive digital space including top-of-the-line accessibility features for Zoom and Microsoft Teams.96
In addition, there is a need for additional hardware and software training for this covered population. Compared to the overall survey respondents, a greater share of individuals with disabilities felt less than comfortable when performing basic, intermediate, and advanced digital skills.97 About three-quarters of respondents who identified as having a disability rarely or never use the Internet to search for available housing, compared to 63% of the overall online public survey respondents.98
Goal 1
All Californians have high-performance broadband available at home, schools, libraries, and businesses.
- Objective 1.3 – Increase the percentage of Californians who report that their internet service is reliable.
- Baseline – Sixty-one percent of individuals with disabilities that responded to the telephone survey rate the reliability of their internet service a “4” or “5” (highest possible), 1% lower than what overall survey respondents reported (62%).[191]
Goal 2
All Californians have access to affordable broadband and necessary devices.
- Objective 2.1 – Decrease the percentage of Californians who cite cost as the primary barrier to internet service.
- Baseline – According to the online public survey, 76% of individuals with disabilities that do not subscribe to home internet cite the cost as a reason, 6% higher than overall survey respondents (70%).[192]
- Objective 2.2 – Reduce the percentage of Californians who rely solely on a smartphone to use the internet.
- Baseline – Twelve percent of individuals with disabilities that responded to the online public survey rely solely on a smartphone to access the internet, 2% higher than overall survey respondents (10%).[193]
- Objective 2.4 – Reduce the average cost that covered populations pay for internet service.
- Baseline – Telephone survey results show that Californians spend an average $83.60/month on broadband, but individuals with disabilities pay an average of $86.30/month.[194]
Goal 3
All Californians can access training and support to enable digital inclusion.
- Objective 3.1 – Increase the availability of digital literacy, cybersecurity, and skills training programs.
- Baseline – Twenty-six percent of individuals with disabilities that responded to the online public survey say that they do not have access to technical support in their household or community, 4% higher than overall survey respondents (22%).[195]
- Objective 3.2 – Increase the percentage of Californians who have access to technical support services for internet-connected devices.
- Baseline – Twenty-six percent of individuals with disabilities that responded to the online public survey say that they do not have access to technical support in their household or community, 4% higher than overall survey respondents (22%).[196]
- Objective 3.3 – Reduce the percentage of Californians whose concerns for privacy and cybersecurity prevents broadband adoption or effective use.
- Baseline – Twenty-five percent of individuals with disabilities that responded to the online public survey are unfamiliar with cybersecurity measures, and 19% have no cybersecurity measures set up on their devices or do not know if they do.[197] These rates are higher than those for overall online public survey respondents; 22% of whom are unfamiliar with cybersecurity, and 17% of whom have no cybersecurity measures setup on their devices or do not know if they do.
- Objective 3.4 – Increase the percentage of Californians who possess basic, intermediate, and advanced digital literacy skills.
- Baseline – Individuals with disabilities who responded to the online public survey reported higher rates of discomfort with multiple basic digital skills compared to overall survey respondents. For example, 21% of respondents with disabilities say they are less than comfortable sending an email with an attached image or document, compared to 15% of overall respondents;[198] 25% are less than comfortable with downloading and installing a new app on their smartphone or tablet, compared to 19% overall; 22% are less than comfortable making an appointment online (e.g. DMV), compared to 17% overall; and 19% are less than comfortable when paying bills online, compared to 15% overall.[199] Individuals with disabilities who responded to the online public survey also reported higher rates of discomfort with advanced digital skills, compared to overall survey respondents. For example, 43% of individuals with disabilities say they are less than comfortable deleting cookies on a web browser, while 36% of overall survey respondents say the same.[200] While 56% of telephone survey respondents were found to have advanced digital skills, just 43% of those with disabilities reported the same.[201]
- Objective 3.6 – Increase the percentage of Californians who utilize the internet to apply for or use public benefits and other essential services and can participate in civic and social engagement online.
- Baseline – Forty-one percent of individuals with disabilities who responded to the online public survey rarely or never use the internet to apply for or use public benefits (e.g., CalFresh/SNAP, Medi-Cal, Social Security, etc.), 14% lower than overall respondents to the online public survey (55%).[202]
Individuals with Language Barriers
| Covered Population | Specific Barriers |
| Individuals with Language Barriers |
|
CDT worked with the Central Valley Immigrant Integration Collaborative (CVIIC), the Latino Coalition for a Healthy California, Parent Institute for Quality Education (PIQE), the Canal Alliance, Mission Economic Development Agency, and Self-Help for the Elderly to better understand the barriers to digital equity facing those with language barriers.
Individuals with language barriers face unique challenges, especially related to the availability of information and digital skills training in an individual’s primary language. This lack of language-specific resources can make it difficult to build skills, and compared to the overall survey population, a greater share of respondents with limited English proficiency feels less than comfortable when performing basic, intermediate, and advanced digital skills.102
Workshop and outcome area working group participants raised concerns about the lack of digital skills training in their native language, and particularly, in Indigenous languages.103 In addition, a mistrust of government and corporations presents a barrier to providing resources and support that individuals are comfortable with.
Goal 1
All Californians have high-performance broadband available at home, schools, libraries, and businesses.
- Objective 1.1 – Increase the percentage of Californians who are connected to broadband internet service.
- Baseline – According to a representative sample of Californians surveyed by telephone for this Plan, 15% of individuals with language barriers cannot connect to the internet at home, significantly higher than the 9% of overall survey respondents.[203]
- Objective 1.3 – Increase the percentage of Californians who report that their internet service is reliable.
- Baseline – While 62% of telephone survey respondents rate the reliability of their service at “4” or “5” (highest possible), only 54% of individuals with language barriers do so.[204]
Goal 2
All Californians have access to affordable broadband and necessary devices.
- Objective 2.1 – Decrease the percentage of Californians who cite cost as the primary barrier to internet service.
- Baseline – According to the online public survey, 76% of individuals with language barriers that do not have home internet cite cost as a reason, 6% higher than overall online survey respondents (70%).[205]
- Objective 2.2 – Reduce the percentage of Californians who rely solely on a smartphone to use the internet.
- Baseline – Twenty-three percent of individuals with language barriers that responded to the online public survey rely solely on a smartphone to access the internet, more than double the rate of overall survey respondents (10%)[206]
- Objective 2.3 – Increase the percentage of Californians enrolled in low-cost internet options and subsidies.
- Baseline – Twenty-nine percent of individuals with language barriers that responded to the telephone survey have heard of the ACP, lower than the overall survey respondents (32%).[207]
Goal 3
All Californians can access training and support to enable digital inclusion.
- Objective 3.1 – Increase the availability of digital literacy, cybersecurity, and skills training programs.
- Baseline – Sixty-one percent of individuals with language barriers that responded to the online public survey say they would be interested in internet or computer training classes for them or their family, nearly double the rate of overall survey respondents (33%) and the highest proportion of any covered population.[208]
- Objective 3.2 – Increase the percentage of Californians who have access to technical support services for internet-connected devices.
- Baseline – Twenty-three percent of individuals with language barriers that responded to the online public survey say they do not have access to technical support in Their household or community, 1% higher than overall online public survey respondents (22%).[209]
- Objective 3.3 – Reduce the percentage of Californians whose concerns for privacy and cybersecurity prevents broadband adoption or effective use.
- Baseline – Fifty-four percent of individuals with language barriers that responded to the online public survey are not familiar with cybersecurity measures, and 33% have no cybersecurity measures set up on their devices or do not know if they do. These rates are significantly higher than overall public survey respondents, 22% of which are unfamiliar with cybersecurity, and 17% of which have no cybersecurity measures setup on their devices or do not know if they do.[210]
- Objective 3.4 – Increase the percentage of Californians who possess basic, intermediate, and advanced digital literacy skills.
- Baseline – Individuals with disabilities who responded to the online public survey reported higher rates of discomfort with multiple basic digital skills compared to overall survey respondents. For example, 21% of respondents with disabilities say they are less than comfortable sending an email with an attached image or document, compared to 15% of overall respondents;[211] 25% are less than comfortable with downloading and installing a new app on their smartphone or tablet, compared to 19% overall; 22% are less than comfortable making an appointment online (e.g. DMV), compared to 17% overall; and 19% are less than comfortable when paying bills online, compared to 15% overall.[212] Individuals with disabilities who responded to the online public survey also reported higher rates of discomfort with advanced digital skills, compared to overall survey respondents. For example, 43% of individuals with disabilities say they are less than comfortable deleting cookies on a web browser, while 36% of overall survey respondents say the same.[213] While 56% of telephone survey respondents were found to have advanced digital skills, just 43% of those with disabilities reported the same.[214]
- Objective 3.6 – Increase the percentage of Californians who utilize the internet to apply for or use public benefits and other essential services and can participate in civic and social engagement online.
- Baseline – While 46% of all telephone survey respondents say they use telehealth, only 37% of individuals with language barriers reported the same.[215]
Individuals who are Members of a Racial or Ethnic Minority Group
| Covered Population | Specific Barriers |
| Individuals who are Members of a Racial or Ethnic Minority Group |
|
CDT worked with many of the same organizations that serve individuals with language barriers such as the Central Valley Immigrant Integration Collaborative (CVIIC), the Latino Coalition for a Healthy California, PIQE, the Canal Alliance, Mission Economic Development Agency, and Self-Help for the Elderly to better understand the barriers to digital equity facing individuals who are members of a racial or ethnic minority group.
One example of a unique barrier for those who are members of racial or ethnic minority groups is the availability of digital skills training resources in multiple languages. Online public survey respondents belonging to a racial or ethnic minority group demonstrated a high interest in such resources: 43% are interested in Internet or computer training classes, compared to 33% of overall respondents.109 In addition, a mistrust of government and corporations presents a barrier to providing resources and support that individuals are comfortable with.
Goal 1
All Californians have high-performance broadband available at home, schools, libraries, and businesses.
- Objective 1.1 – Increase the percentage of Californians who are connected to broadband internet service.
- Baseline – According to a representative sample of Californians surveyed by telephone for this Plan, 12% of residents who identify as Hispanic/Latino cannot connect to the Internet at home, higher than the 9% of overall respondents. However, African American residents are connected at a rate similar to the state as a whole. The gap for other racial/ethnic groups (including Asian Americans) is generally smaller, although it is worth noting that the sample size is insufficient to characterize gaps for other groups, such as Native American or Alaska Native and for Native Hawaiian and Pacific Islander.[216]
- Objective 1.3 – Increase the percentage of Californians who report that their internet service is reliable.
- Baseline – Fifty-nine percent of individuals that identify as part of an ethnic or racial minority group that responded to the telephone survey rate the reliability of their internet service a “4” or “5” (highest possible), 3% points lower than what overall survey respondents reported (62%).[217]
Goal 2
All Californians have access to affordable broadband and necessary devices.
- Objective 2.1 – Decrease the percentage of Californians who cite cost as the primary barrier to internet service.
- Baseline – According to the online public survey, 75% of respondents who identify as a racial or ethnic minority cite cost as a reason for not having an internet connection at home, 5% higher than overall survey respondents (70%).[218]
- Objective 2.2 – Reduce the percentage of Californians who rely solely on a smartphone to use the internet.
- Baseline – According to the online public survey, 15% of respondents who identify as a racial or ethnic minority use only a smartphone to access the internet, 5% higher than survey respondents overall (10%).[219]
Goal 3
All Californians can access training and support to enable digital inclusion.
- Objective 3.1 – Increase the availability of digital literacy, cybersecurity, and skills training programs.
- Baseline – According to the online public survey, 33% of respondents are interested in digital skills training, and this share is much higher for respondents who identify as a racial or ethnic minority (43%).[220]
- Objective 3.3 – Reduce the percentage of Californians whose concerns for privacy and cybersecurity prevents broadband adoption or effective use.
- Baseline – Thirty-three percent of respondents who identify as a racial or ethnic minority are unfamiliar with cybersecurity; 24% have no cybersecurity measures set up on their devices, or do not know if they do. These proportions are higher than those for overall survey respondents, 22% of which are unfamiliar with cybersecurity, and 17% of which have no cybersecurity measures set up on their devices or do not know if they do.[221]
- Objective 3.4 – Increase the percentage of Californians who possess basic, intermediate, and advanced digital skills.
- Baseline – While 56% of telephone survey respondents were found to have advanced digital skills, 54% of those who identify as part of a racial or ethnic minority group reported the same.[222]
- Objective 3.6 – Increase the percentage of Californians who utilize the internet to apply for or use public benefits and other essential services and can participate in civic and social engagement online.
- Baseline – While 46% of overall telephone survey respondents use telehealth, a slightly lower percentage (43%) of those who identify as racial or ethnic minorities say the same.[223]
Individuals who Primarily Reside in a Rural Area
| Covered Population | Specific Barriers |
| Individuals who Primarily Reside in a Rural Area |
|
CDT collaborated with the Rural County Representatives of California (RCRC), broadband consortia, and tribal communities throughout California, and numerous community-based organizations and residents at rural planning workshops to understand the barriers to digital equity faced by those primarily residing in rural areas.
Residents in rural areas face unique barriers. A lack of infrastructure and lack of competition limit residents’ options. Of the online public survey respondents that primarily reside in rural areas, 48% described their Internet service at home, in terms of speed and reliability, as not adequate (compared to 31% of all respondents).[224] Participants from rural areas (inclusive of tribal community members) noted in multiple engagement scenarios that a lack of sufficient broadband infrastructure is a significant barrier.[225] As one individual put it, “Our biggest barrier is the availability of broadband, and whether that broadband is adequate.”[226]
According to Internet speed test data from the online public survey, rural residents had the greatest share of respondents with inadequate Internet speeds, with 44% of speed test respondents who lived in rural areas having inadequate download speeds below 25 Mbps (compared to 27% of overall speed test respondents).[227]
One notable finding is the interest in digital training; 26% of online public survey respondents residing in rural areas are interested in Internet or computer training classes. However, 22% of online public survey respondents residing in rural areas cannot access support with devices or the internet in their community, which is an added unique barrier.[228] In addition, the presence of wildfires and disasters coupled with distance from support resources presents a challenge.
Goal 1
All Californians have high-performance broadband available at home, schools, libraries, and businesses.
- Objective 1.1 – Increase the percentage of Californians who are connected to broadband internet service.
- Baseline – According to a representative sample of Californians surveyed by telephone for this Plan, 11% of rural residents cannot connect to the internet from home, 2% higher than respondents overall (9%).[229]
- Objective 1.3 – Increase the percentage of Californians who report that their internet service is reliable.
- Baseline – While nearly two-thirds of telephone survey respondents (about 62%) rate the reliability of their service at “4” or “5” (highest possible), this percentage is lower among those who primarily reside in a rural area (54%).[230]
Goal 2
All Californians have access to affordable broadband and necessary devices.
- Objective 2.4 – Reduce the average cost that covered populations pay for internet service.
- Baseline – Telephone survey results show that Californians spend an average $83.60/month on broadband, but individuals who primarily reside in a rural area pay $88.20/month on average.[231]
Goal 3
All Californians can access training and support to enable digital inclusion.
- Objective 3.4 – Increase the percentage of Californians who possess basic, intermediate, and advanced digital literacy skills.
- Baseline – 33% of overall online survey respondents are interested in internet or computer training classes, though just 26% of individuals primarily residing in rural areas say the same.[232] While 56% of telephone survey respondents were found to have advanced digital skills, just 51% of those primarily residing in rural areas reported the same.[233]
- Objective 3.6 – Increase the percentage of Californians who utilize the internet to apply for or use public benefits and other essential services and can participate in civic and social engagement online.
- Baseline – While 46% of overall respondents to the telephone survey use telehealth, 44% of residents primarily residing in rural areas say the same.[234]
LGBTQIA+ Community
| Digitally Disadvantaged Community | Specific Barriers |
| LGBTQIA+ Community |
|
Members of the LGBTQIA+ community noted barriers regarding a lack of safe spaces for connecting to broadband and accessing digital literary sources.[235] Another barrier is that they are underrepresented in the broadband industry and actively promoting positions to members of the LGBTQIA+ community could address that barrier.[236]
Goal 1
All Californians have high-performance broadband available at home, schools, libraries, and businesses.
- Objective 1.3 – Increase the percentage of Californians who report that their internet service is reliable.
- Baseline – Fifty-nine percent of individuals that identify as LGBTQIA+ that responded to the telephone survey rate the reliability of their internet service a “4” or “5” (highest possible), 3% points lower than what overall survey respondents reported (62%).[237]
Goal 2
All Californians have access to affordable broadband and necessary devices.
- Objective 2.3 – Increase the percentage of Californians enrolled in low-cost internet options and subsidies.
- Baseline – Twenty-nine percent of individuals that identify as LGBTQIA+ that responded to the telephone survey have heard of the ACP, lower than the overall survey respondents (32%).[238]
- Objective 2.4 – Reduce the average cost that covered populations pay for internet service.
- Baseline – Telephone survey results show that Californians spend an average $83.60/month on broadband, but individuals that identify as LGBTQIA+ spend an average of $100.90/month.[239]
Goal 3
All Californians can access training and support to enable digital inclusion.
- Objective 3.1 – Increase the availability of digital literacy, cybersecurity, and skills training programs.
- Baseline – Twenty-one percent of individuals that identify as LGBTQIA+ that responded to the online public survey say that they would be interested in internet or computer training classes for them or their family; this is 2% lower than overall online public survey respondents (33%).[240]
Women, and Those Who Identify as Female
| Digitally Disadvantaged Community | Specific Barriers |
| Women, and those who identify as female |
|
Ninety-three percent of women and those who identify as female reported having broadband access, an increase of 5% since 2021.[241] While they may have access to broadband, women and those who identify as female noted that meeting the needs of work and childcare create barriers to digital equity.[242] Those experiencing displacement and trauma due to domestic violence also face barriers to digital equity, as access in the home may be compromised.[243]
Additionally, recruiting women to jobs in the broadband industry and providing them with apprenticeship opportunities was a theme we heard repeatedly.[244] By providing supportive spaces for women to obtain the necessary digital literacy skills, with a focus on skills necessary for employment, a barrier for women can be lowered.[245]
Goal 2
All Californians have access to affordable broadband and necessary devices.
- Objective 2.1 – Decrease the percentage of Californians who cite cost as the primary barrier to internet service.
- Baseline – Twenty-four percent of those who identify as women that responded to the online public survey cite cost as a reason for not having internet at home, 4% higher than overall respondents (70%).[246]
Goal 3
All Californians can access training and support to enable digital inclusion.
- Objective 3.1 – Increase the availability of digital literacy, cybersecurity, and skills training programs.
- Baseline – Thirty-six percent of individuals that identify as women that responded to the online public survey say that they would be interested in internet or computer training classes for them or their family; this is 3% higher than overall online public survey respondents (33%).[247]
- Objective 3.3 – Reduce the percentage of Californians whose concerns for privacy and cybersecurity prevents broadband adoption or effective use.
- Baseline – According to the online public survey, 25% of those who identify as women are unfamiliar with cybersecurity, and 21% do not have cybersecurity measures set up on their devices or do not know if they do. These rates are higher than those for overall survey respondents, 22% of which are unfamiliar with cybersecurity, and 17% of which have no cybersecurity measures setup on their devices or do not know if they do.[248]
3.5 Specific Barriers by Priority Outcome Area
In addition to the common barriers and baselines for covered populations and digitally disadvantaged communities, there are also specific barriers for each priority area.
Education
| Priority Area | Specific Barriers |
| Education |
|
Digital equity is critical for achieving education outcomes in the state, especially given that 73% of online public survey respondents use the Internet at least sometimes for educational resources.[249] CDT engaged with multiple entities that are critical to advancing digital equity and educational outcomes. CDE, UC, CSU, CCC, COES, local school districts, PIQE, and others played an important role in the development of this plan and will play an even more important role in its implementation.
A lack of reliable high-speed connectivity at educational institutions creates obstacles for individuals who cannot access the internet at home. According to the online public survey, 57% of respondents who cannot access Internet at home utilize schools and libraries for access to the Internet when they cannot utilize their own connection plan.[250] Overcrowding in students’ homes puts additional strain on networks that compromise the existing infrastructure’s ability to serve students effectively.[251] These challenges are compounded by a lack of awareness about low-cost internet offers and subsidy programs, which further limits access to home internet for families. According to the online public survey, 49% of respondents living in covered households had heard about ACP, and 23% of individuals in covered households were aware of low-cost plans offered by ISPs.[252]
Another barrier is lacking access to affordable devices. According to the online public survey, almost one in four respondents living in covered households did not have access to devices that connected to the Internet at home, aside from their smartphone, compared to one in ten among the general population.[253]
There is also a desire for more access to digital literacy and skills training opportunities. Specifically, 33% of all online public survey respondents are interested in Internet or computer training classes to further their digital literacy skills. This percentage is even higher for underconnected (46%) and unconnected (49%) respondents.[254] Finally, a lack of visibility into available statewide data regarding access, affordability, and adoption presents a barrier to educational outcomes.
Health
| Priority Area | Specific Barriers |
| Health |
|
There are specific barriers to digital equity that impact the State’s health outcomes, as discovered by engaging with HHS, CDPH, CDHS, ITUP, CCHI, Covered CA, CETF Telehealth Initiative, Indian Health Services, and other health-based organizations throughout the State.
A lack of reliable, high-speed connectivity at healthcare anchor institutions,[255] and a lack of home connectivity preventing access to online and virtual healthcare services for patients (see above barriers by covered population) are digital barriers to health.[256] In addition, a lack of access to adequate devices limits patients’ ability to access health services. This is especially true for several covered population groups that historically have specialized healthcare needs: compared to the general population of online public survey respondents, unhoused individuals, individuals with limited English proficiency, individuals in covered households, immigrants, and racial and ethnic minority groups are more likely to only have a smartphone to connect to the Internet, with no other device for Internet access.[257] Further, unhoused individuals, individuals in tribal communities, and those in lower-income households were more likely than the general online public survey population to have no device at all to connect to the Internet.[258]
Individuals also have trouble navigating online health resources due to a lack of digital skills. Overall, 15% of respondents to the online public survey rarely or never access healthcare online, indicating that telehealth services are underutilized.[259] Furthermore, unhoused individuals and individuals with limited English proficiency have a higher respondent share who rarely or never use Internet for accessing healthcare.[260] Finally, a lack of data related to digital equity and community and individual health presents a barrier to achieving state health outcomes.
| Priority Area | Specific Barriers |
| Digital Literacy and Inclusion |
|
CSL, CDA, CETF, regional and local organizations, Regional Broadband Consortia, the San Diego Futures Foundation, Community Tech Network, OATS, and AARP assisted in identifying specific barriers related to digital literacy and inclusion in the state.
A lack of access to infrastructure, the cost of internet service, and low adoption of internet services prevent individuals from accessing critical online resources. A lack of affordable devices also presents a challenge, especially for some covered populations. Unhoused individuals, those belonging to tribal communities, and individuals in covered households were all more likely than total respondents to the online public survey population to not have a device that can connect to the internet.[261] Additionally, 10% of all respondents who had access used a smartphone as their sole device for home Internet connection, and this was more likely to be true for unhoused individuals, individuals with limited English proficiency, lower-income individuals, immigrants, racial or ethnic minorities, individuals with disabilities, and individuals belonging to a tribal group.[262]
Individuals also reported a lack of technical expertise along with a lack of access to training resources, indicating that more avenues are needed to build digital skills. There is a pronounced need among aging individuals, individuals with disabilities, unhoused individuals, immigrants, lower-income individuals, and individuals with limited English proficiency, all of whom were more likely than the general population to report a lack of familiarity and discomfort with basic, intermediate, and advanced digital literacy skills.[263] Despite the demonstrated need for building digital literacy skills, many respondents do not have access to resources to provide support. Specifically, one in five online public survey respondents did not have access to technical support or assistance within their household or community.[264] Unhoused individuals, lower-income individuals, and individuals with disabilities were more likely to report this lack of support.[265]
Workforce and Economic Development
| Priority Area | Specific Barriers |
| Workforce and Economic Development |
|
There are several barriers that specifically impact workforce and economic development outcomes in the state as noted by LWDA, GO-Biz, CCC, Calbright College, NextGen Policy, CWA, and many other partners including the National Skills Coalition, Fiber Broadband Association, Fiber Optic Association, the Wireless Internet Association, NPower, DevMission and Tech Exchange.
A lack of broadband infrastructure presents a barrier to accessing workforce opportunities, prevents business and economic development, and limits small business growth. This is particularly true for those primarily residing in rural areas, as nearly 70% of rural respondents who did not have home Internet access cited lack of availability in their area.[266]
Additionally, a lack of internet service, devices, and access to digital skills training perpetuates systems of exclusion and limits opportunity for covered populations. Unhoused individuals, individuals in covered households, and individuals with limited English proficiency are less likely than the general population to have home internet, and more likely to access the internet solely through a mobile data plan.[267]
There is also a significant need among covered populations for digital skills training. Aging individuals, individuals with disabilities, unhoused individuals, immigrants, individuals residing in covered households, and individuals with limited English proficiency were all more likely than the general population to report lack of familiarity and discomfort with basic, intermediate, and advanced digital literacy skills.[268]
Without access to home internet, adequate devices, and digital skills obtaining education and training, getting a job, or working remotely is extremely difficult. Certain covered populations were less likely than overall online public survey respondents to use the internet to work from home, including low-income respondents, unhoused respondents, aging individuals, and individuals with disabilities.[269]
Essential Service, Accessibility, and Civic Engagement
| Priority Area | Specific Barriers |
| Essential Services, Accessibility, and Civic Engagement |
|
CDT, ODI, GovOps, and other local and regional entities were key partners in developing this Plan, especially in identifying barriers to digital equity for essential services, accessibility, and civic engagement. According to online public survey data, most people are not utilizing online civic and essential service tools. For example, about two-thirds of online public survey respondents rarely or never use the Internet for participating in public or government meetings.[270] Specific barriers to accessing these resources might include a lack of affordable Internet service.
Forty-two percent of respondents pay more than $100 for their home internet service, and this number is even higher for individuals in rural areas (51%), veterans (46%), and tribal communities (46%).[271] The cost of internet may present a barrier for some in accessing online resources and civic engagement opportunities.
In addition, a lack of culturally inclusive resources and the digital literacy skills needed to navigate them may keep people from using the Internet for essential and civic services. The rapid pace of technological change could also present a barrier for those who find it challenging to familiarize themselves with new technology platforms or skills.
Tribal Collaboration
| Priority Area | Specific Barriers |
| Tribal Collaboration |
|
In California, there are currently 109 federally recognized tribes and 62 non-federally recognized tribes. Tribal communities face specific and unique barriers to digital equity which we heard about through ongoing conversation and consultation with the California Native American tribes and tribal entities.
Both a lack of infrastructure[272] and the cost of available internet[273] present significant barriers to broadband adoption among tribal communities. About half of the online public survey respondents who self-identifies as belonging to a tribal community and did not have a home Internet subscription reported lack of availability as one of the main barriers, and about two-thirds reported that cost was a main barrier.[274]
In addition, tribal communities face a specific vulnerability to disasters and a lack of supporting infrastructure for broadband, such as reliable roads and power. Persistent poverty, a lack of trust, and hesitancy associated with digital literacy initiatives present additional barriers for tribal communities.[275] However, many tribes expressed that limited staffing and lack of in-house broadband subject matter expertise limit capacity to address addressing barriers.[276] Tribal specific programs, such as the ACP Enhanced Tribal Benefit,[277] can also be limited in reach, as eligibility is often limited to those that live on tribal lands. This limitation can present challenges for individuals that are members of tribes but do not live on tribal land.[278]
References
[104] https://broadbandcouncil.ca.gov/wp-content/uploads/sites/68/2020/12/BB4All-Action-Plan-Final.pdf, page 9.
[105] https://broadbandcouncil.ca.gov/wp-content/uploads/sites/68/2020/12/BB4All-Action-Plan-Final.pdf, page 9.
[106] https://www.benton.org/blog/internet-all-california
[107] https://broadbandcouncil.ca.gov/wp-content/uploads/sites/68/2020/12/BB4All-Action-Plan-Final.pdf, Page 8, Accessed September 6, 2023.
[108] https://www.cpuc.ca.gov/-/media/cpuc-website/divisions/communications-division/documents/broadband-implementation-for-california/bead/california-bead-five-year-action-plan—final-draft—20230828.pdf, accessed September 16, 2023, page 105.
[109] https://broadbandforall.cdt.ca.gov/affordable-connectivity-program/acp-enrollment/, Accessed on September 16, 2023.
[110] Digital Equity Needs Assessment and Asset Inventory for the State of CA, August 28, 2023, slide 75.
[111] Digital Literacy and Inclusion Outcome Area Working Group Meeting, virtual, February 15, 2023.
[112] U.S. Census Bureau, Digital Equity Act Population Viewer, https://mtgis-portal.geo.census.gov/arcgis/apps/webappviewer/index.html?id=c5e6cf675865464a90ff1573c5072b42.
[113] Bar, F., Galperin, H., Le, T., 2023 Statewide Digital Equity Survey, page 36.
[114] Digital Equity Needs Assessment and Asset Inventory for the State of CA, August 28, 2023, slide 32.
[115] https://ntia.gov/other-publication/2022/digital-nation-data-explorer#sel=pcOrTabletUser&disp=map.
[116] Bar, F., Galperin, H., Le, T., 2023 Statewide Digital Equity Survey, page 45.
[117] Digital Equity Needs Assessment and Asset Inventory for the State of CA, August 28, 2023.
[118] Digital Equity Needs Assessment and Asset Inventory for the State of CA, August 28, 2023, slide 35.
[119] https://broadbandcouncil.ca.gov/wp-content/uploads/sites/68/2020/12/BB4All-Action-Plan-Final.pdf, Page 20, Accessed September 17, 2023.
[120] https://www.calfund.org/digital-equity-initiative/#issue-background, Access September 14, 2023.
[121] Education Digital Equity OAWG, Pages 7-9, Presentation by Philip Neufeld, Executive Officer Enterprise Infrastructure and Services Fresno Unified School District, Education OAWG, March 14, 2023.
[122] California Broadband Council Meeting July 25, 2023 – YouTube, 1 hr, 52 minutes, Public Comment by Patrick Messac, Director, #OaklandUndivided.
[123] https://www.cpuc.ca.gov/industries-and-topics/internet-and-phone/california-advanced-services-fund/casf-consortia-account, Accessed September 16, 2023.
[124] https://www.cetfund.org/wp-content/uploads/2021/04/Getting-Connected-A-Broadband-Deployment-and-Adoption-Resource-Guide-For-Local-and-Regional-Government-Leaders.pdf.
[125] https://www.cpuc.ca.gov/-/media/cpuc-website/divisions/communications-division/documents/broadband-implementation-for-california/bead/california-bead-five-year-action-plan—final-draft—20230828.pdf.
[126] Department of Technology: state digital equity plan. (ca.gov), Cal. Gov. Code § 11546.46 (2023).
[127] Digital Equity Needs Assessment and Asset Inventory for the State of CA, August 28, 2023, slide 101.
[128] Bar, F., Galperin, H., Le, T., 2023 Statewide Digital Equity Survey, page 36; Digital Equity Needs Assessment and Asset Inventory for the State of CA, August 28, 2023, slide 13.
[129] Bar, F., Galperin, H., Le, T., 2023 Statewide Digital Equity Survey, pages 21-22.
[130] Bar, F., Galperin, H., Le, T., 2023 Statewide Digital Equity Survey, page 30.
[131] Broadband for All Cvr Letter and Action Plan 2020 (ca.gov), page 11.
[132] Broadband for All Cvr Letter and Action Plan 2020 (ca.gov), page 12.
[133] Broadband for All Cvr Letter and Action Plan 2020 (ca.gov), page 12-13.
[134] Broadband for All Cvr Letter and Action Plan 2020 (ca.gov), page 13.
[135] California Public Utilities Commission, 2021/2022 Annual Affordability Report, October 2023, https://www.cpuc.ca.gov/-/media/cpuc-website/divisions/energy-division/documents/affordability-proceeding/2021-2022/2021-and-2022-annual-affordability-report.pdf.
[136] Communications Workers of America District 9, Jobs with Justice San Francisco, Labor Network for Sustainability, United Steelworkers District 12, United Steelworkers Local 675, (pg. 3-8, 10-11), https://docs.cpuc.ca.gov/PublishedDocs/Efile/G000/M506/K522/506522994.PDF.
[137] Affordable Connectivity Program enrollment tracker, https://broadbandforall.cdt.ca.gov/affordable-connectivity-program/acp-enrollment/; Accessed on August 27, 2023.
[138] Bar, F., Galperin, H., Le, T., 2023 Statewide Digital Equity Survey, page 39.
[139] Bar, F., Galperin, H., Le, T., 2023 Statewide Digital Equity Survey, page 44.
[140] Bar, F., Galperin, H., Le, T., 2023 Statewide Digital Equity Survey, page 44.
[141] Bar, F., Galperin, H., Le, T., 2023 Statewide Digital Equity Survey, page 25.
[142] Federal Communications Commission, Urban Rate Survey Data & Resources, https://www.fcc.gov/economics-analytics/industry-analysis-division/urban-rate-survey-data-resources.
[143] Digital Equity Needs Assessment and Asset Inventory for the State of CA, August 28, 2023, slide 18.
[144] https://www.cpuc.ca.gov/industries-and-topics/internet-and-phone/competition.
[145] State of California Five-Year Action Plan: Broadband Equity, Access, and Deployment (BEAD) Program, August 28, 2023, page 43.
[146] Bar, F., Galperin, H., Le, T., 2023 Statewide Digital Equity Survey, page 36.
[147] Digital Equity Needs Assessment and Asset Inventory for the State of CA, August 28, 2023, slide 31.
[148] Digital Equity Needs Assessment and Asset Inventory for the State of CA, August 28, 2023, slide 31.
[149] California Broadband Council, Broadband for All Action Plan, 2020, https://broadbandcouncil.ca.gov/wp-content/uploads/sites/68/2020/12/BB4All-Action-Plan-Final.pdf.
[150] Bar, F., Galperin, H., Le, T., 2023 Statewide Digital Equity Survey, page 37.
[151] For the purposes of the online public survey, the advanced skills asked about include, 1) setting up protection against phishing and spam email, 2) setting up parental controls, and 3) deleting cookies on a web browser.
[152] Bar, F., Galperin, H., Le, T., 2023 Statewide Digital Equity Survey, page 46.
[153] Digital Equity Needs Assessment and Asset Inventory for the State of CA, August 28, 2023, slide 34.
[154] Digital Equity Needs Assessment and Asset Inventory for the State of CA, August 28, 2023, slide 34.
[155] Digital Equity Needs Assessment and Asset Inventory for the State of CA, August 28, 2023, slide 53.
[156] Digital Equity Needs Assessment and Asset Inventory for the State of CA, August 28, 2023, slide 14.
[157] Bar, F., Galperin, H., Le, T., 2023 Statewide Digital Equity Survey, page 22.
[158] Bar, F., Galperin, H., Le, T., 2023 Statewide Digital Equity Survey, page 30.
[159] Digital Equity Needs Assessment and Asset Inventory for the State of CA, August 28, 2023, slide 31.
[160] Digital Equity Needs Assessment and Asset Inventory for the State of CA, August 28, 2023, slide 34.
[161] Digital Equity Needs Assessment and Asset Inventory for the State of CA, August 28, 2023, slide 33.
[162] Digital Equity Needs Assessment and Asset Inventory for the State of CA, August 28, 2023, slide 53-54.
[163] Digital Equity Needs Assessment and Asset Inventory for the State of CA, August 28, 2023, slide 34.
[164] Digital Equity Needs Assessment and Asset Inventory for the State of CA, August 28, 2023, slide 45.
[165] Bar, F., Galperin, H., Le, T., 2023 Statewide Digital Equity Survey, page 46.
[166] Bar, F., Galperin, H., Le, T., 2023 Statewide Digital Equity Survey, page 51.
[167] Bay Area Digital Inclusion Coalition Meeting, March 28, 2023.
[168] Bay Area Digital Inclusion Coalition Meeting, March 28, 2023.
[169] Digital Equity Needs Assessment and Asset Inventory for the State of CA, August 28, 2023, slide 35.
[170] Digital Equity Needs Assessment and Asset Inventory for the State of CA, August 28, 2023, slide 35.
[171] Bar, F., Galperin, H., Le, T., 2023 Statewide Digital Equity Survey, page 44.
[172] Bar, F., Galperin, H., Le, T., 2023 Statewide Digital Equity Survey, page 27.
[173] Digital Equity Needs Assessment and Asset Inventory for the State of CA, August 28, 2023, slide 34.
[174] Digital Equity Needs Assessment and Asset Inventory for the State of CA, August 28, 2023, slide 33.
[175] Digital Equity Needs Assessment and Asset Inventory for the State of CA, August 28, 2023, slide 53.
[176] Digital Equity Needs Assessment and Asset Inventory for the State of CA, August 28, 2023, slide 34.
[177] Digital Equity Needs Assessment and Asset Inventory for the State of CA, August 28, 2023, slide 41.
[178] Bar, F., Galperin, H., Le, T., 2023 Statewide Digital Equity Survey, page 46.
[179] Ameelio Recommendations, August 31, 2023, slide 9.
[180] Ameelio Recommendations, August 31, 2023, slide 10.
[181] California Department of Corrections and Rehabilitation, Tablets and Telephone Calls, https://www.cdcr.ca.gov/family-resources/tablets/
[182] Digital Literacy and Inclusion Outcome Area Working Group, June 15, 2023.
[183] Working Session with the California Department of Veterans Affairs (CalVet), March 29, 2023.
[184] Digital Equity Needs Assessment and Asset Inventory for the State of CA, August 28, 2023, slide 19.
[185] Bar, F., Galperin, H., Le, T., 2023 Statewide Digital Equity Survey, page 27.
[186] Digital Equity Needs Assessment and Asset Inventory for the State of CA, August 28, 2023, slide 34.
[187] Bar, F., Galperin, H., Le, T., 2023 Statewide Digital Equity Survey, page 46.
[188] Digital Equity Needs Assessment and Asset Inventory for the State of CA, August 28, 2023, slide 64.
[189] Bar, F., Galperin, H., Le, T., 2023 Statewide Digital Equity Survey, page 26.
[190] Bar, F., Galperin, H., Le, T., 2023 Statewide Digital Equity Survey, page 26.
[191] Bar, F., Galperin, H., Le, T., 2023 Statewide Digital Equity Survey, page 30.
[192] Digital Equity Needs Assessment and Asset Inventory for the State of CA, August 28, 2023, slide 15.
[193] Digital Equity Needs Assessment and Asset Inventory for the State of CA, August 28, 2023, slide 31.
[194] Bar, F., Galperin, H., Le, T., 2023 Statewide Digital Equity Survey, page 27.
[195] Digital Equity Needs Assessment and Asset Inventory for the State of CA, August 28, 2023, slide 33.
[196] Digital Equity Needs Assessment and Asset Inventory for the State of CA, August 28, 2023, slide 33.
[197] Digital Equity Needs Assessment and Asset Inventory for the State of CA, August 28, 2023, slides 53-54.
[198] Digital Equity Needs Assessment and Asset Inventory for the State of CA, August 28, 2023, slide 36.
[199] Digital Equity Needs Assessment and Asset Inventory for the State of CA, August 28, 2023, slide 42.
[200] Digital Equity Needs Assessment and Asset Inventory for the State of CA, August 28, 2023, slide 48.
[201] Bar, F., Galperin, H., Le, T., 2023 Statewide Digital Equity Survey, page 46.
[202] Digital Equity Needs Assessment and Asset Inventory for the State of CA, August 28, 2023, slide 64.
[203] Bar, F., Galperin, H., Le, T., 2023 Statewide Digital Equity Survey, page 25.
[204] Bar, F., Galperin, H., Le, T., 2023 Statewide Digital Equity Survey, page 30.
[205] Digital Equity Needs Assessment and Asset Inventory for the State of CA, August 28, 2023, slide 15.
[206] Digital Equity Needs Assessment and Asset Inventory for the State of CA, August 28, 2023, slide 31.
[207] Bar, F., Galperin, H., Le, T., 2023 Statewide Digital Equity Survey, page 40.
[208] Digital Equity Needs Assessment and Asset Inventory for the State of CA, August 28, 2023, slide 34.
[209] Digital Equity Needs Assessment and Asset Inventory for the State of CA, August 28, 2023, slide 33.
[210] Digital Equity Needs Assessment and Asset Inventory for the State of CA, August 28, 2023, slides 53-54.
[211] Digital Equity Needs Assessment and Asset Inventory for the State of CA, August 28, 2023, slide 36.
[212] Digital Equity Needs Assessment and Asset Inventory for the State of CA, August 28, 2023, slide 42.
[213] Digital Equity Needs Assessment and Asset Inventory for the State of CA, August 28, 2023, slide 48.
[214] Bar, F., Galperin, H., Le, T., 2023 Statewide Digital Equity Survey, page 46.
[215] Bar, F., Galperin, H., Le, T., 2023 Statewide Digital Equity Survey, page 51.
[216] Bar, F., Galperin, H., Le, T., 2023 Statewide Digital Equity Survey, page 22.
[217] Bar, F., Galperin, H., Le, T., 2023 Statewide Digital Equity Survey, page 30.
[218] Digital Equity Needs Assessment and Asset Inventory for the State of CA, August 28, 2023, slide 15.
[219] Digital Equity Needs Assessment and Asset Inventory for the State of CA, August 28, 2023, slide 31.
[220] Digital Equity Needs Assessment and Asset Inventory for the State of CA, August 28, 2023, slide 34.
[221] Digital Equity Needs Assessment and Asset Inventory for the State of CA, August 28, 2023, slides 53-54.
[222] Bar, F., Galperin, H., Le, T., 2023 Statewide Digital Equity Survey, page 46.
[223] Bar, F., Galperin, H., Le, T., 2023 Statewide Digital Equity Survey, page 51.
[224] Digital Equity Needs Assessment and Asset Inventory for the State of CA, August 28, 2023, slide 22.
[225] Local and regional workshop, Wednesday, May 3, 2023, Eureka CA; Local and regional workshop, Saturday, April 15, 2023, Fresno CA; Local and regional workshop, Tuesday, May 16, 2023, San Bernardino CA; Local and regional workshop, Friday, April 14, 2023, Merced CA.
[226] Bree Doan, Education outcome area working group, Tuesday, February 14, 2023, virtual.
[227] Digital Equity Needs Assessment and Asset Inventory for the State of CA, August 28, 2023, slide 23.
[228] Digital Equity Needs Assessment and Asset Inventory for the State of CA, August 28, 2023, slides 33.
[229] Bar, F., Galperin, H., Le, T., 2023 Statewide Digital Equity Survey, page 26.
[230] Bar, F., Galperin, H., Le, T., 2023 Statewide Digital Equity Survey, page 30.
[231] Bar, F., Galperin, H., Le, T., 2023 Statewide Digital Equity Survey, page 27.
[232] Digital Equity Needs Assessment and Asset Inventory for the State of CA, August 28, 2023, slides 34.
[233] Bar, F., Galperin, H., Le, T., 2023 Statewide Digital Equity Survey, page 46.
[234] Bar, F., Galperin, H., Le, T., 2023 Statewide Digital Equity Survey, page 51.
[235] Local and regional workshop, Wednesday, June 2, 2023, Seaside CA.
[236] Local and regional workshop, Friday, May 24, 2023, Santa Ana CA.
[237] Bar, F., Galperin, H., Le, T., 2023 Statewide Digital Equity Survey, page 30.
[238] Bar, F., Galperin, H., Le, T., 2023 Statewide Digital Equity Survey, page 40.
[239] Bar, F., Galperin, H., Le, T., 2023 Statewide Digital Equity Survey, page 27.
[240] Digital Equity Needs Assessment and Asset Inventory for the State of CA, August 28, 2023, slide 34.
[241] Bar, F., Galperin, H., Le, T., 2023 Statewide Digital Equity Survey, page 14.
[242] Local and regional workshop, Friday, April 21, 2023, San Diego CA; Local and regional workshop, Friday, May 19, 2023, Los Angeles CA; Local and regional workshop, Friday, April 14, 2023, Merced CA; Local and regional workshop, Wednesday, June 8, Oakland CA; Local and regional workshop, Friday, May 5, San Jose CA; Local and regional workshop, Saturday, April 15, Fresno CA.
[243] Local and regional workshop, Tuesday, May 16, 2023, San Bernardino CA.
[244] Local and regional workshop, Friday, June 2, 2023, Seaside CA; Local and regional workshop, Friday, May 19, 2023, Los Angeles CA.
[245] Local and regional workshop, Thursday, May 11, 2023, Sacramento CA.
[246] Digital Equity Needs Assessment and Asset Inventory for the State of CA, August 28, 2023, slide 15.
[247] Digital Equity Needs Assessment and Asset Inventory for the State of CA, August 28, 2023, slide 34.
[248] Digital Equity Needs Assessment and Asset Inventory for the State of CA, August 28, 2023, slides 53-54.
[249] Digital Equity Needs Assessment and Asset Inventory for the State of CA, August 28, 2023, slide 57.
[250] Digital Equity Needs Assessment and Asset Inventory for the State of CA, August 28, 2023, slide 72.
[251] Anne Marie Richard, education outcome area working group, Tuesday, May 16, 2023, virtual.
[252] Digital Equity Needs Assessment and Asset Inventory for the State of CA, August 28, 2023, slide 74.
[253] Digital Equity Needs Assessment and Asset Inventory for the State of CA, August 28, 2023, slide 31.
[254] Digital Equity Needs Assessment and Asset Inventory for the State of CA, August 28, 2023, slide 34.
[255] Health outcome area working group, Thursday, February 16, 2023, virtual; Health outcome area working group, Thursday, March 16, 2023, virtual; Health outcome area working group, Thursday, June 15, 2023, virtual.
[256] https://www.itup.org/wp-content/uploads/2023/05/ITUP-Broadband-Bootcamp-Report-Final.pdf.
[257] Digital Equity Needs Assessment and Asset Inventory for the State of CA, August 28, 2023, slide 31.
[258] Digital Equity Needs Assessment and Asset Inventory for the State of CA, August 28, 2023, slide 32.
[259] Digital Equity Needs Assessment and Asset Inventory for the State of CA, August 28, 2023, slide 56.
[260] Digital Equity Needs Assessment and Asset Inventory for the State of CA, August 28, 2023, slide 56.
[261] Digital Equity Needs Assessment and Asset Inventory for the State of CA, August 28, 2023, slide 32.
[262] Digital Equity Needs Assessment and Asset Inventory for the State of CA, August 28, 2023, slide 31.
[263] Digital Equity Needs Assessment and Asset Inventory for the State of CA, August 28, 2023, slides 35-52.
[264] Digital Equity Needs Assessment and Asset Inventory for the State of CA, August 28, 2023, slide 33.
[265] Digital Equity Needs Assessment and Asset Inventory for the State of CA, August 28, 2023, slide 33.
[266] Digital Equity Needs Assessment and Asset Inventory for the State of CA, August 28, 2023, slide 15.
[267] Digital Equity Needs Assessment and Asset Inventory for the State of CA, August 28, 2023, slides 30-31.
[268] Digital Equity Needs Assessment and Asset Inventory for the State of CA, August 28, 2023, slides 35-52.
[269] Digital Equity Needs Assessment and Asset Inventory for the State of CA, August 28, 2023, slide 60.
[270] Digital Equity Needs Assessment and Asset Inventory for the State of CA, August 28, 2023, slide 63.
[271] Digital Equity Needs Assessment and Asset Inventory for the State of CA, August 28, 2023, slide 18.
[272] Tribal collaboration outcome area working group, Tuesday, March 21, 2023, virtual.
[273] Tribal collaboration outcome area working group, Tuesday, May 16, 2023, virtual.
[274] Digital Equity Needs Assessment and Asset Inventory for the State of CA, August 28, 2023, slide 37.
[275] Tribal Collaboration Outcome Area Working Group, Friday, February 17, 2023, virtual; Local and regional workshop, Tuesday, May 30, 2023, Tuolumne CA.
[276] Local and regional workshop, Thursday, June 1, 2023, Santa Maria CA.
[277] https://www.affordableconnectivity.gov/do-i-qualify/enhanced-tribal-benefit/.
[278] Ferguson, Z. (2023.) Closing California’s Digital Divide: Preliminary Recommendations to Overcome Digital Equity Barriers for Covered Populations and Achieve Equitable Outcomes through Tribal Collaboration.
/* for the small tables with blue headings */