Statewide Middle-Mile Network Map
Track the Build: Project Status Map
The Project Status Interactive Network Map visualizes the current progress of network route miles across various statuses: pre-construction, installation, and ready-to-connect. If you’re specifically interested in when the Middle-Mile will be available in your area, explore the map and click on a county. This action will highlight the statuses at which those miles are currently being installed. A pop-up box will also appear, offering further details about the county. For a more detailed breakdown, refer to the table below, which outlines each county’s installation miles (pre-construction, installation, and ready-to-connect).
Regional construction updates can be found on the Network Regions page.
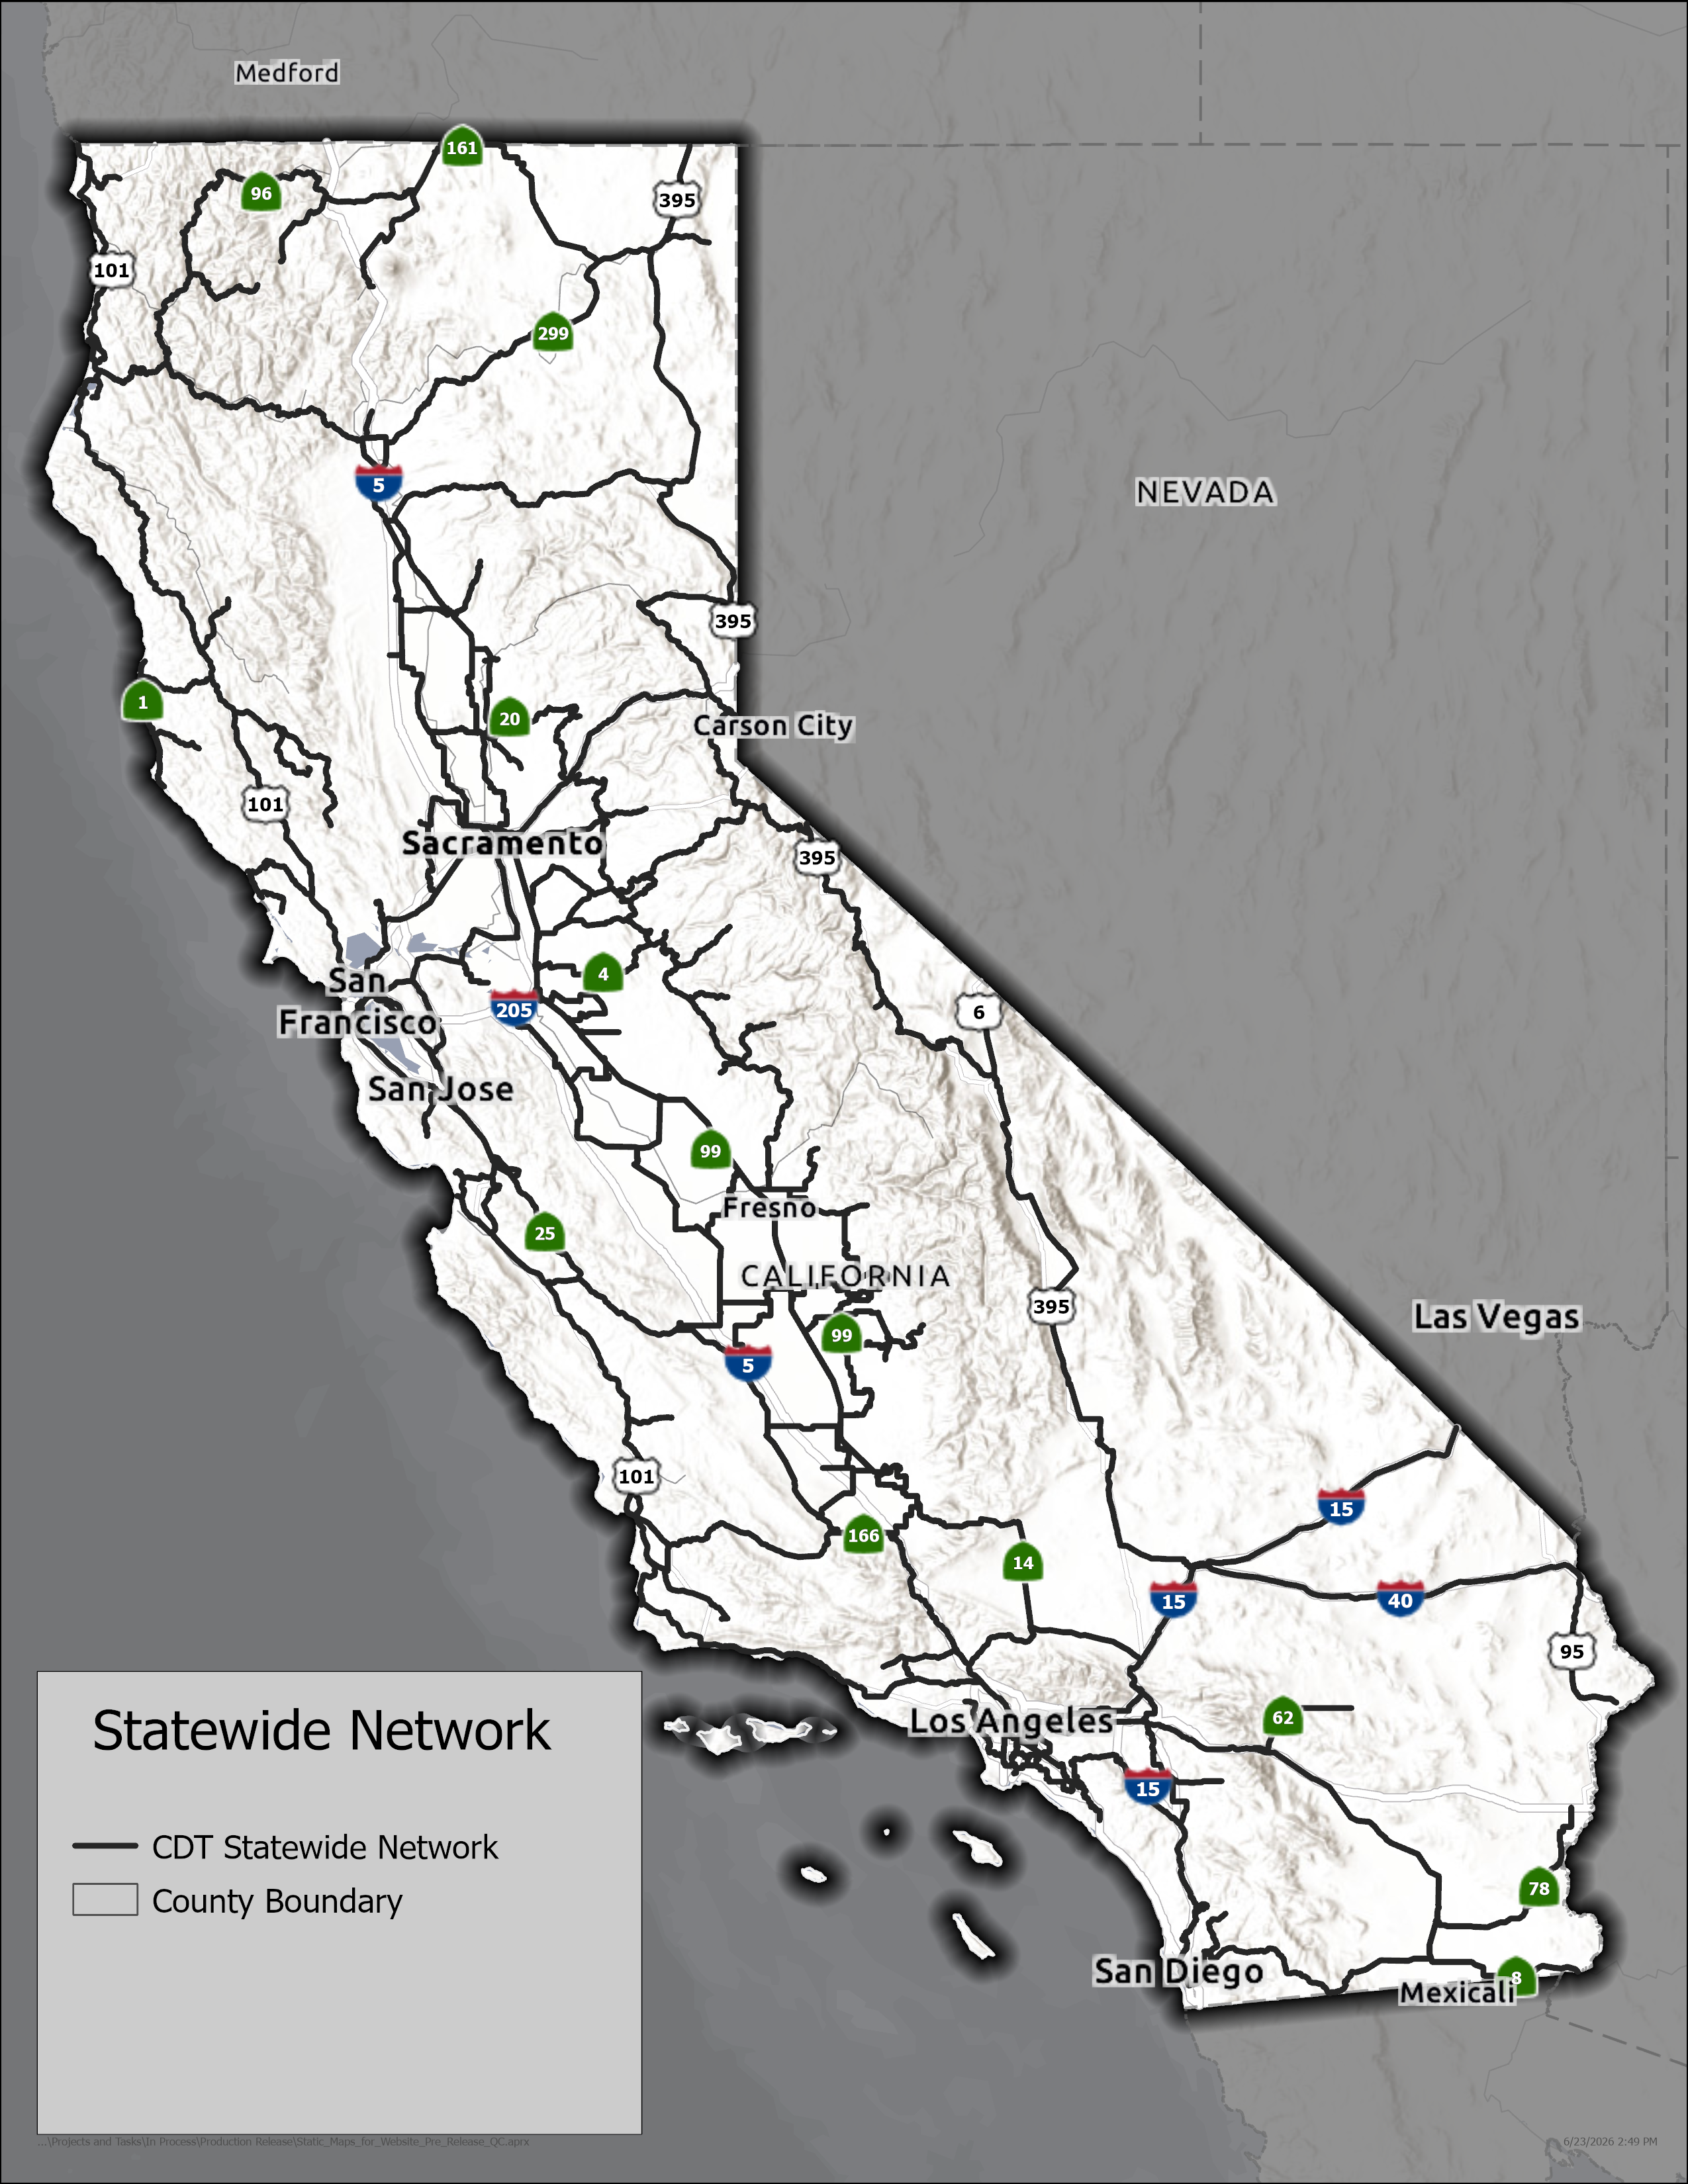
Statewide Network Map
Legend Guide:
- Black lines: CDT Statewide Network
- Outline in gray polygon: County Boundary
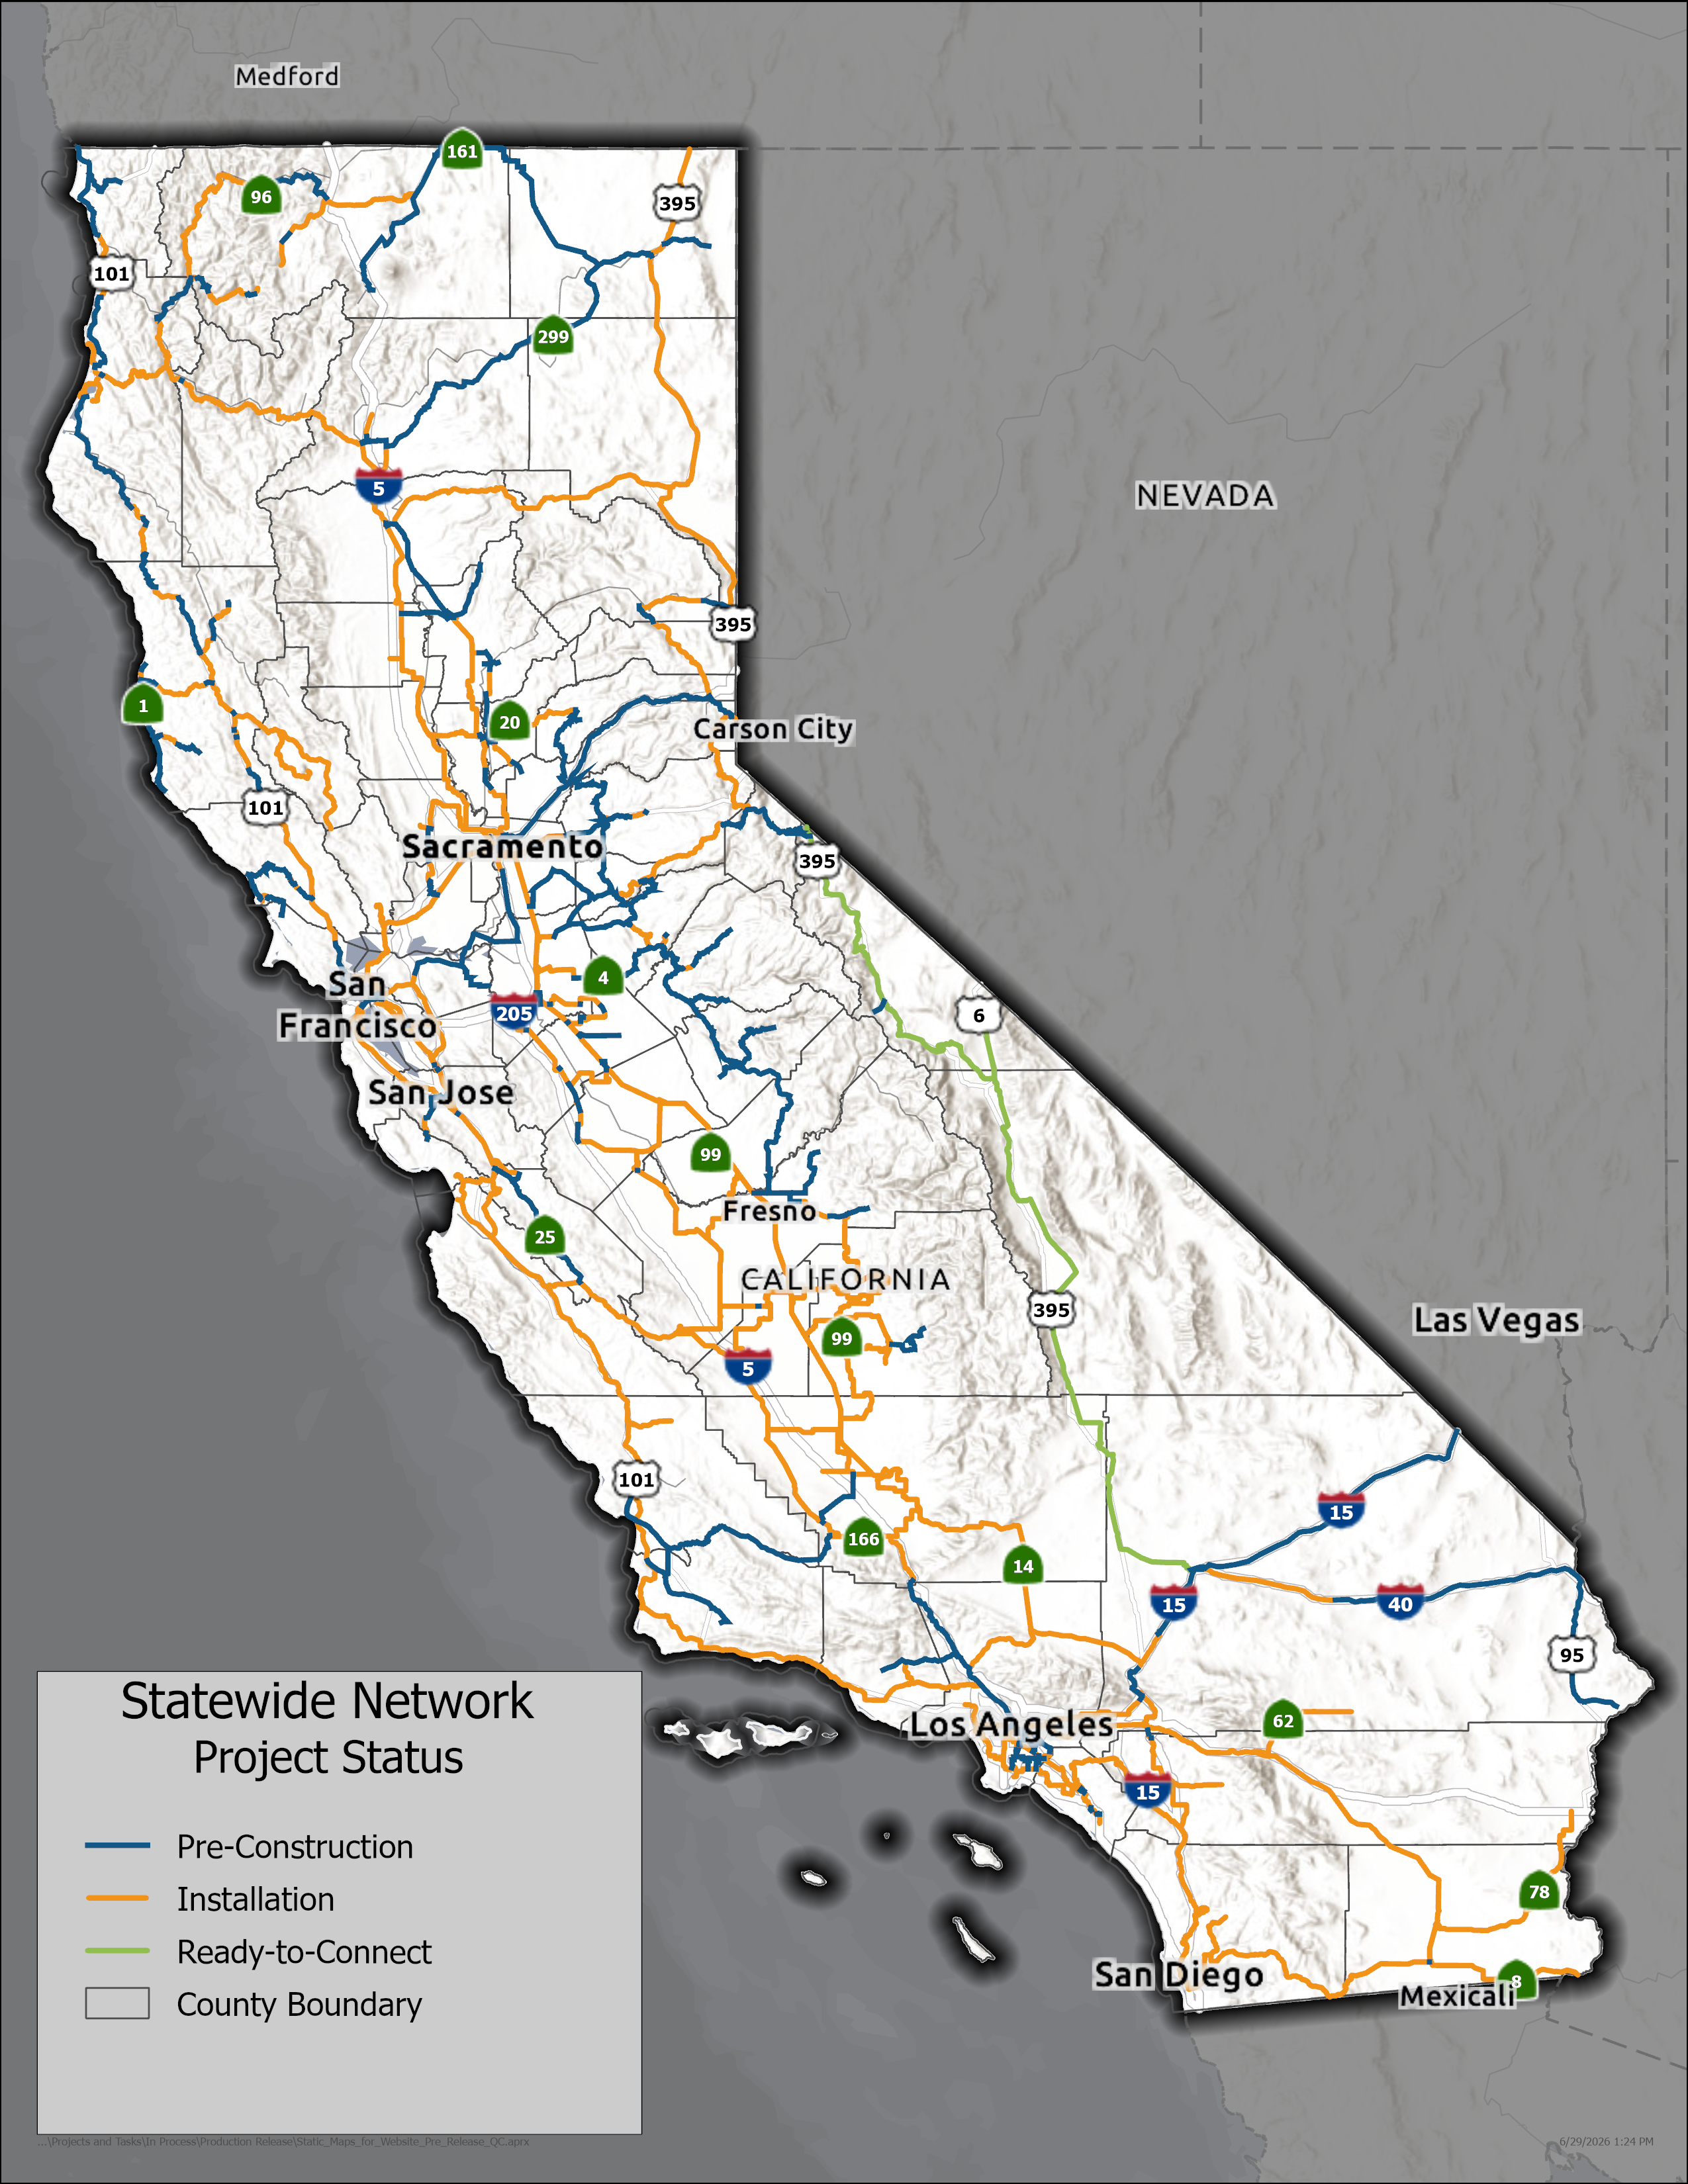
Project Status Map
Legend Guide:
- Blue lines: Pre-Construction
- Orange lines: Installation
- Green lines: Ready-to-Connect
- Outline in gray polygon: County Boundary
Network Miles by County
Table Description:
- County: Location of the network.
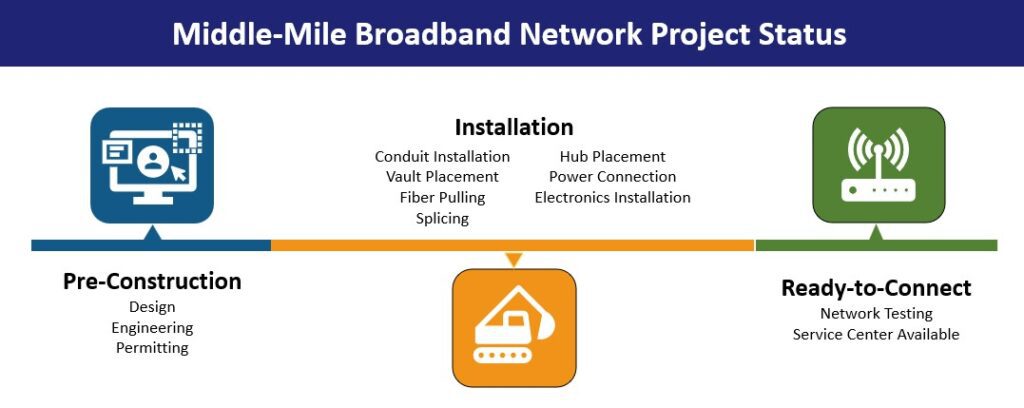
- Pre-Construction Miles: The activities are design, engineering, and permitting.
- Installation Miles: In the Installation status, the following activities are performed: Conduit Installation, Vault Placement, Fiber Pulling, Splicing, Hub Placement, Power Connection, and Electronics Installation.
- Ready-to-Connect Miles: In the Ready-to-Connect status, the following activities are performed: the network service center is established. Network testing occurs to confirm that segment(s) is operational and secure.
- Total Miles: Total network miles for county.
| County Name | Pre-Construction Miles | Installation Miles | Ready-to-Connect Miles | Total Miles |
|---|---|---|---|---|
| Alameda | 8.7 | 102.1 | 0 | 110.8 |
| Alpine | 41.0 | 2.5 | 0 | 43.5 |
| Amador | 52.6 | 53.6 | 0 | 106.2 |
| Butte | 63.4 | 51.4 | 0 | 114.8 |
| Calaveras | 84.2 | 20.8 | 0 | 105.0 |
| Colusa | 0.8 | 42.4 | 0 | 43.2 |
| Contra Costa | 38.0 | 56.2 | 0 | 94.2 |
| Del Norte | 54.4 | 10.0 | 0 | 64.4 |
| El Dorado | 72.6 | 47.6 | 0 | 120.2 |
| Fresno | 61.9 | 229.1 | 0 | 291.0 |
| Glenn | 10.5 | 38.6 | 0 | 49.1 |
| Humboldt | 111.4 | 141.3 | 0 | 252.7 |
| Imperial | 3.4 | 225.1 | 0 | 228.5 |
| Inyo | 0 | 0 | 147.2 | 147.2 |
| Kern | 41.3 | 381.2 | 31.5 | 454.0 |
| Kings | 2.7 | 130.7 | 0 | 133.4 |
| Lake | 0 | 89.7 | 0 | 89.7 |
| Lassen | 29.6 | 168.0 | 0 | 197.6 |
| Los Angeles | 140.1 | 282.6 | 0 | 422.7 |
| Madera | 54.3 | 38.4 | 0 | 92.7 |
| Marin | 31.5 | 9.5 | 0 | 41.0 |
| Mariposa | 90.4 | 0 | 0 | 90.4 |
| Mendocino | 117.7 | 132.7 | 0 | 250.4 |
| Merced | 9.6 | 119.6 | 0 | 129.2 |
| Modoc | 112.0 | 61.5 | 0 | 173.5 |
| Mono | 12.5 | 0 | 175.3 | 187.8 |
| Monterey | 1.4 | 149.7 | 0 | 151.1 |
| Napa | 0 | 17.3 | 0 | 17.3 |
| Nevada | 53.6 | 26.8 | 0 | 80.4 |
| Orange | 5.6 | 90.0 | 0 | 95.6 |
| Placer | 99.5 | 21.0 | 0 | 120.5 |
| Plumas | 14.4 | 42.0 | 0 | 56.4 |
| Riverside | 7.3 | 247.9 | 0 | 255.2 |
| Sacramento | 79.6 | 86.2 | 0 | 165.8 |
| San Benito | 57.5 | 42.9 | 0 | 100.4 |
| San Bernardino | 326.4 | 192.4 | 69.0 | 587.8 |
| San Diego | 1.2 | 189.1 | 0 | 190.3 |
| San Francisco | 3.2 | 15.7 | 0 | 18.9 |
| San Joaquin | 67.2 | 108.2 | 0 | 175.4 |
| San Luis Obispo | 65.7 | 87.4 | 0 | 153.1 |
| San Mateo | 2.2 | 31.8 | 0 | 34.0 |
| Santa Barbara | 84.6 | 105.3 | 0 | 189.9 |
| Santa Clara | 21.0 | 91.7 | 0 | 112.7 |
| Santa Cruz | 0.1 | 10.0 | 0 | 10.1 |
| Shasta | 87.1 | 67.4 | 0 | 154.5 |
| Sierra | 0 | 32.8 | 0 | 32.8 |
| Siskiyou | 143.9 | 167.8 | 0 | 311.7 |
| Solano | 8.1 | 52.6 | 0 | 60.7 |
| Sonoma | 42.0 | 72.0 | 0 | 114.0 |
| Stanislaus | 38.4 | 87.6 | 0 | 126.0 |
| Sutter | 10.0 | 58.9 | 0 | 68.9 |
| Tehama | 28.2 | 107.6 | 0 | 135.8 |
| Trinity | 0.1 | 72.5 | 0 | 72.6 |
| Tulare | 24.4 | 230.9 | 0 | 255.3 |
| Tuolumne | 77.5 | 4.3 | 0 | 81.8 |
| Ventura | 28.9 | 71.2 | 0 | 100.1 |
| Yolo | 12.1 | 84.4 | 0 | 96.5 |
| Yuba | 23.2 | 27.4 | 0 | 50.6 |
| Grand Total Miles | 2,659.0 | 5,127.4 | 423.0 | 8,209.4 |
Note: Installation miles reflect segments where physical construction is actively underway. In any given month, additional miles may have been permitted by partners who have not yet broken ground. Those miles will be reflected here as construction begins.
Updated June 29, 2026
Data
- Map Update Log – Summary of route and map updates on the Statewide Middle-Mile Network Map.
- Middle-Mile Broadband Network – Download a CSV, Shapefile, GeoJSON, and/or KML of the current network.
- California State Geoportal – Discover, analyze, and download Middle-Mile Broadband Initiative data from the California State Geoportal.